

One of the great perks of Python is that you can build solutions for real-life problems. This applies in almost every industry. From building models to predict diseases to building web apps that can forecast the future sales of your online store, knowing how to code enables you to think outside of the box and broadens your professional horizons as a data scientist.
Whether you’ve just learned the Python basics or already have significant knowledge of the programming language, knowing your way around predictive programming and learning how to build a model is essential for machine learning. In this practical tutorial, we’ll learn together how to build a binary logistic regression in 5 quick steps.
Table of Contents
- What Is a Predictive Model?
- Predictive Modeling: Applications
- How to Build a Predictive Model in Python?
- Predictive Modelling: Next Steps
What Is a Predictive Model?
As the name implies, predictive modeling is used to determine a certain output using historical data. For example, you can build a recommendation system that calculates the likelihood of developing a disease, such as diabetes, using some clinical & personal data such as:
- Age
- Gender
- Weight
- Average glucose level
- Daily calories
This way, doctors are better prepared to intervene with medications or recommend a healthier lifestyle.
Another use case for predictive models is forecasting sales. Using time series analysis, you can collect and analyze a company’s performance to estimate what kind of growth you can expect in the future.
Essentially, with predictive programming, you collect historical data, analyze it, and train a model that detects specific patterns so that when it encounters new data later on, it’s able to predict future results.
There are different predictive models that you can build using different algorithms. Popular choices include regressions, neural networks, decision trees, K-means clustering, Naïve Bayes, and others.
Predictive Modelling Applications
There are many ways to apply predictive models in the real world. Most industries use predictive programming either to detect the cause of a problem or to improve future results. Applications include but are not limited to:
- Fraud detection
- Sales forecasting
- Natural disaster relief
- Business performance growth
- Speech recognition
- News categorization
- Vehicle maintenance
As the industry develops, so do the applications of these models. Companies are constantly looking for ways to improve processes and reshape the world through data. In a few years, you can expect to find even more diverse ways of implementing Python models in your data science workflow.
How to Build a Predictive Model in Python?
As mentioned, there’re many types of predictive models. We’ll be focusing on creating a binary logistic regression with Python – a statistical method to predict an outcome based on other variables in our dataset. The word binary means that the predicted outcome has only 2 values: (1 & 0) or (yes & no).
We’ll build a binary logistic model step-by-step to predict floods based on the monthly rainfall index for each year in Kerala, India.
Step 1: Import Python Libraries
First and foremost, import the necessary Python libraries. In our case, we’ll be working with pandas, NumPy, matplotlib, seaborn, and scikit-learn.
To import them, use the following code:
import pandas as pd
import numpy as np
import matplotlib.pyplot as plt
import seaborn as sns
from sklearn import model_selection
from sklearn.linear_model import LogisticRegression
from sklearn.model_selection import train_test_split
Step 2: Read the Dataset
We use pandas to display the first 5 rows in our dataset:
df= pd.read_csv('kerala.csv')
df.head(5)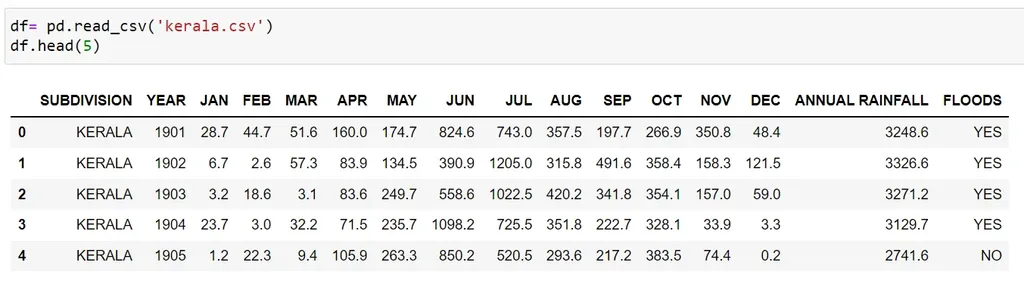
Step 3: Explore the Dataset
It’s important to know your way around the data you’re working with so you know how to build your predictive model. For this reason, Python has several functions that will help you with your explorations.
info()
The info() function shows us the data type of each column, number of columns, memory usage, and the number of records in the dataset:
df.info()
shape
The shape function displays the number of records and columns:
df.shape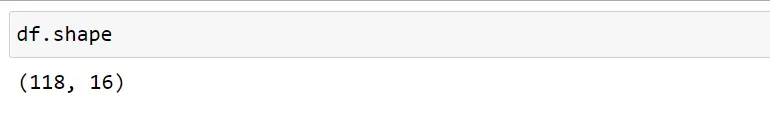
describe()
The describe() function summarizes the dataset’s statistical properties, such as count, mean, min, and max:
df.describe()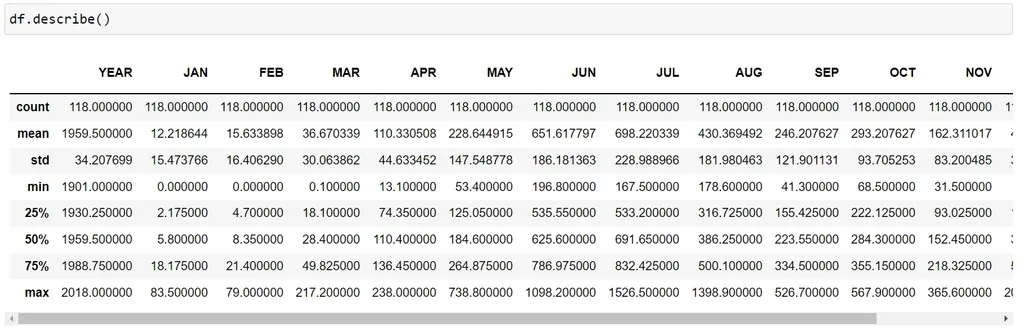
It’s also useful to see if any column has null values since it shows us the count of values in each one.
corr()
The corr() function displays the correlation between different variables in our dataset:
df.corr()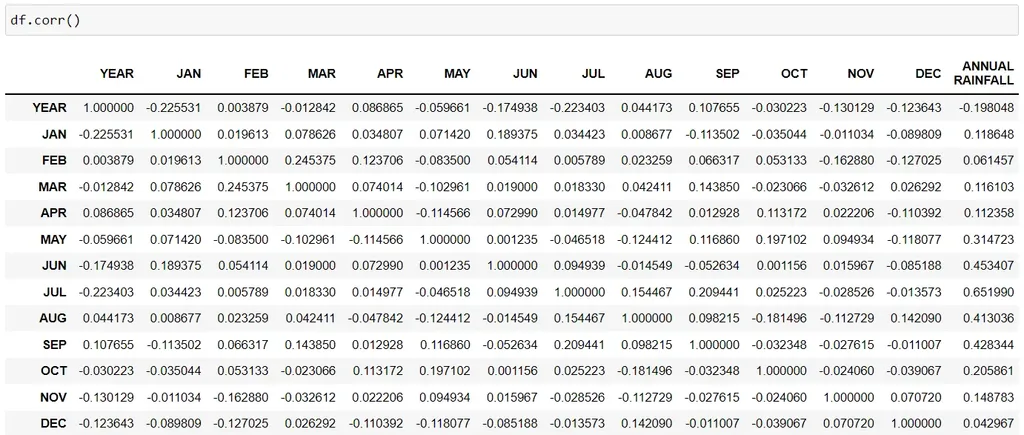
The closer to 1, the stronger the correlation between these variables.
A minus sign means that these 2 variables are negatively correlated, i.e. one decreases with increasing the other and vice versa.
replace
In order to train this Python model, we need the values of our target output to be 0 & 1. So, we'll replace values in the Floods column (YES, NO) with (1, 0) respectively:
df['FLOODS'].replace(['YES', 'NO'], [1,0], inplace=True)
df.head(5)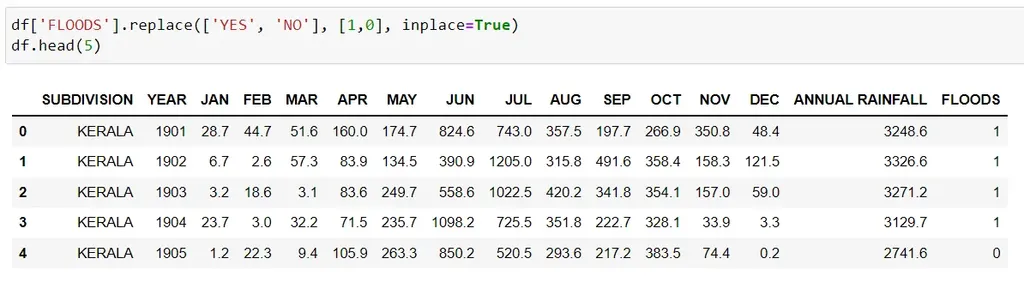
* in place= True means we want this replacement to be reflected in the original dataset, i.e. the change is permanent.
Step 3: Feature Selection
In this step, we choose several features that contribute most to the target output. So, instead of training the model using every column in our dataset, we select only those that have the strongest relationship with the predicted variable.
Use the SelectKBest library to run a chi-squared statistical test and select the top 3 features that are most related to floods.
Author’s note: In case you want to learn about the math behind feature selection the 365 Linear Algebra and Feature Selection course is a perfect start.
Start by importing the SelectKBest library:
from sklearn.feature_selection import SelectKBest
from sklearn.feature_selection import chi2
After, define X & Y:
X= df.iloc[:,1:14]   all features
Y= df.iloc[:,-1]   target output (floods)
Select the top 3 features:
best_features= SelectKBest(score_func=chi2, k=3)
fit= best_features.fit(X,Y)
Now we create data frames for the features and the score of each feature:
df_scores= pd.DataFrame(fit.scores_)
df_columns= pd.DataFrame(X.columns)
Finally, we’ll combine all the features and their corresponding scores in one data frame:
features_scores= pd.concat([df_columns, df_scores], axis=1)
features_scores.columns= ['Features', 'Score']
features_scores.sort_values(by = 'Score')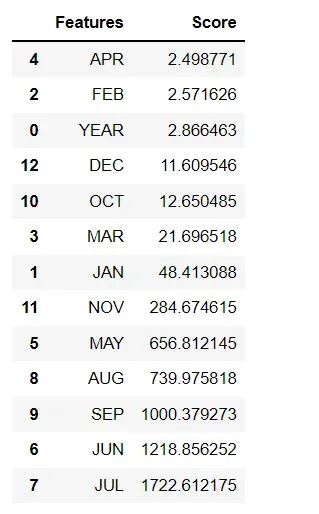
Here, we notice that the top 3 features that are most related to the target output are:
- 'SEP' which is the rainfall index in September
- 'JUN' is the rainfall index in June
- 'JUL' is the rainfall index in July
Step 4: Build the Model
Now it’s time to get our hands dirty. First, split the dataset into X and Y:
X= df[['SEP', 'JUN', 'JUL']]  the top 3 features
Y= df[['FLOODS']]  the target output
Second, split the dataset into train and test:
X_train,X_test,y_train,y_test=train_test_split(X,Y,test_size=0.4,random_state=100)Third, create a logistic regression body:
logreg= LogisticRegression()
logreg.fit(X_train,y_train)
Finally, we predict the likelihood of a flood using the logistic regression body we created:
y_pred=logreg.predict(X_test)
print (X_test) #test dataset
print (y_pred) #predicted values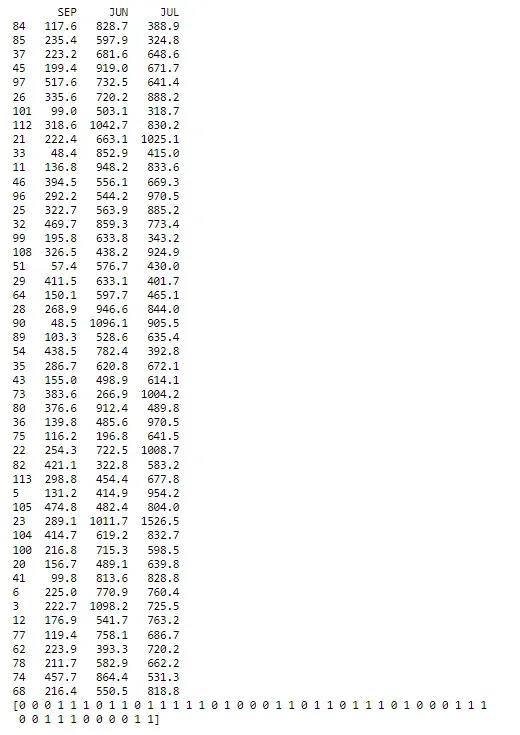
Step 5: Evaluate the Model’s Performance
As a final step, we’ll evaluate how well our Python model performed predictive analytics by running a classification report and a ROC curve.
Classification Report
A classification report is a performance evaluation report that is used to evaluate the performance of machine learning models by the following 5 criteria:
- Accuracy is a score used to evaluate the model’s performance. The higher it is, the better.
- Recall measures the model’s ability to correctly predict the true positive values.
- Precision is the ratio of true positives to the sum of both true and false positives.
- F-score combines precision and recall into one metric. Ideally, its value should be closest to 1, the better.
- Support is the number of actual occurrences of each class in the dataset.
Call these scores by inserting these lines of code:
from sklearn import metrics
from sklearn.metrics import classification_report
print(‘Accuracy: ‘,metrics.accuracy_score(y_test, y_pred))
print(‘Recall: ‘,metrics.recall_score(y_test, y_pred, zero_division=1))
print(“Precision:”,metrics.precision_score(y_test, y_pred, zero_division=1))
print(“CL Report:”,metrics.classification_report(y_test, y_pred, zero_division=1))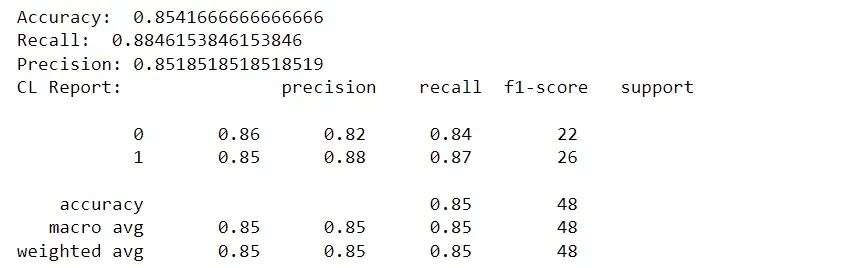
As you can see, the model’s performance in numbers is:
- Accuracy: 85%
- Recall: 88%
- Precision: 85%
We can safely conclude that this model predicted the likelihood of a flood well.
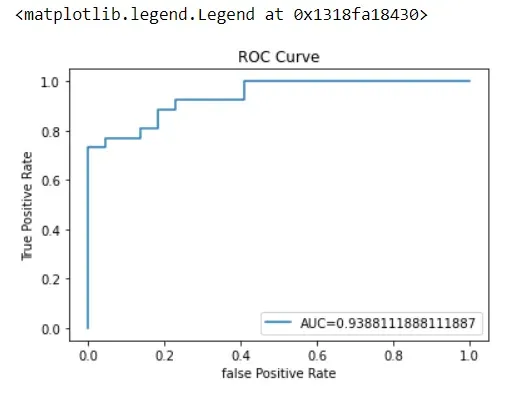
ROC Curve
The receiver operating characteristic (ROC) curve is used to display the sensitivity and specificity of the logistic regression model by calculating the true positive and false positive rates.
From the ROC curve, we can calculate the area under the curve (AUC) whose value ranges from 0 to 1. You’ll remember that the closer to 1, the better it is for our predictive modeling.
To determine the ROC curve, first define the metrics:
y_pred_proba= logreg.predict_proba(X_test) [::,1]Then, calculate the true positive and false positive rates:
false_positive_rate, true_positive_rate, _ = metrics.roc_curve(y_test, y_pred_proba)
Next, calculate the AUC to see the model's performance:
auc= metrics.roc_auc_score(y_test, y_pred_proba)Finally, plot the ROC curve:
plt.plot(false_positive_rate, true_positive_rate,label="AUC="+str(auc))
plt.title('ROC Curve')
plt.ylabel('True Positive Rate')
plt.xlabel('false Positive Rate')
plt.legend(loc=4)
The AUC is 0.94, meaning that the model did a great job:
Predictive Model in Python: Next Steps
If you made it this far, well done! Consider this exercise in predictive programming in Python as your first big step on the machine learning ladder. If you’re a data science beginner itching to learn more about the exciting world of data and algorithms, then you are in the right place!
The 365 Data Science Program offers self-paced courses led by renowned industry experts. Starting from the very basics all the way to advanced specialization, you will learn by doing with a myriad of practical exercises and real-world business cases. If you want to see how the training works, start with a selection of free lessons by signing up below.
Q&A
What Is a Predictive Model in Python?
A predictive model in Python forecasts a certain future output based on trends found through historical data. Essentially, by collecting and analyzing past data, you train a model that detects specific patterns so that it can predict outcomes, such as future sales, disease contraction, fraud, and so on. In other words, when this trained Python model encounters new data later on, it’s able to predict future results.
You can build your predictive model using different data science and machine learning algorithms, such as decision trees, K-means clustering, time series, Naïve Bayes, and others.
Prediction programming is used across industries as a way to drive growth and change. One such way companies use these models is to estimate their sales for the next quarter, based on the data they’ve collected from the previous years. In the same vein, predictive analytics is used by the medical industry to conduct diagnostics and recognize early signs of illness within patients, so doctors are better equipped to treat them.
Can Python be Used for Predictive Analytics?
Yes, Python indeed can be used for predictive analytics. Being one of the most popular programming languages at the moment, Python is rich with powerful libraries that make building predictive models a straightforward process. Some of the popular ones include pandas, NymPy, matplotlib, seaborn, and scikit-learn. In addition to available libraries, Python has many functions that make data analysis and prediction programming easy.
The syntax itself is easy to learn, not to mention adaptable to your analytic needs, which makes it an even more ideal choice for = data scientists and employers alike.
If you utilize Python and its full range of libraries and functionalities, you’ll create effective models with high prediction rates that will drive success for your company (or your own projects) upward. However, before you can begin building such models, you’ll need some background knowledge of coding and machine learning in order to be able to understand the mechanics of these algorithms.
How Do You Write a Predictive Model?
Writing a predictive model comes in several steps. For starters, if your dataset has not been preprocessed, you need to clean your data up before you begin. If you’re using ready data from an external source – such as GitHub or Kaggle – chances are some datasets might have already gone through this step.
It's important to explore your dataset, making sure you know what kind of information is stored there. Calling Python functions like info(), shape, and describe() helps you understand the contents you’re working with so you’re better informed on how to build your model later.
Next up is feature selection. Rarely would you need the entire dataset during training. Therefore, you should select only those features that have the strongest relationship with the predicted variable. In this step, you run a statistical analysis to conclude which parts of the dataset are most important to your model.
It’s now time to build your model by splitting the dataset into training and test data. You want to train the model well so it can perform well later when presented with unfamiliar data.
Finally, you evaluate the performance of your model by running a classification report and calculating its ROC curve.