When you first hear about regressions, you may think that correlation and regression are synonyms or at least they related to the same concept. This statement is somewhat supported by the fact that many academic papers in the past were based solely on correlations.
However, correlation and regression are far from the same concept. So, let’s see what the relationship is between correlation analysis and regression analysis.
There is a single expression that sums it up nicely: correlation does not imply causation!
With that in mind, it’s time to start exploring the various differences between correlation and regression.
1. The Relationship between Variables
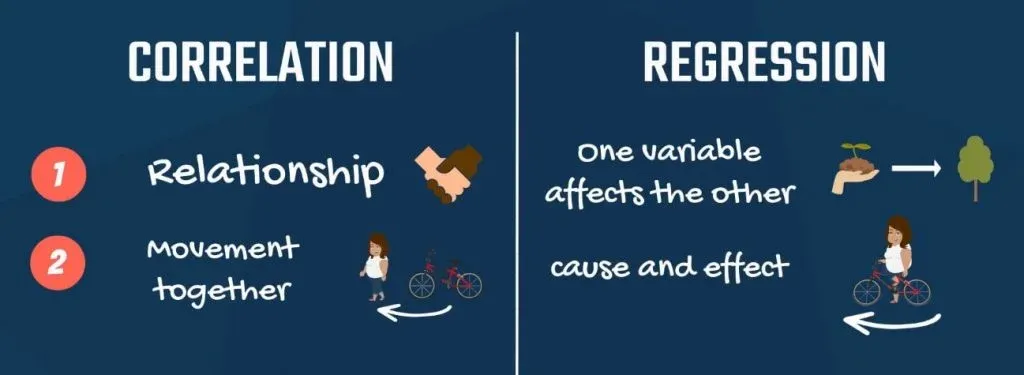
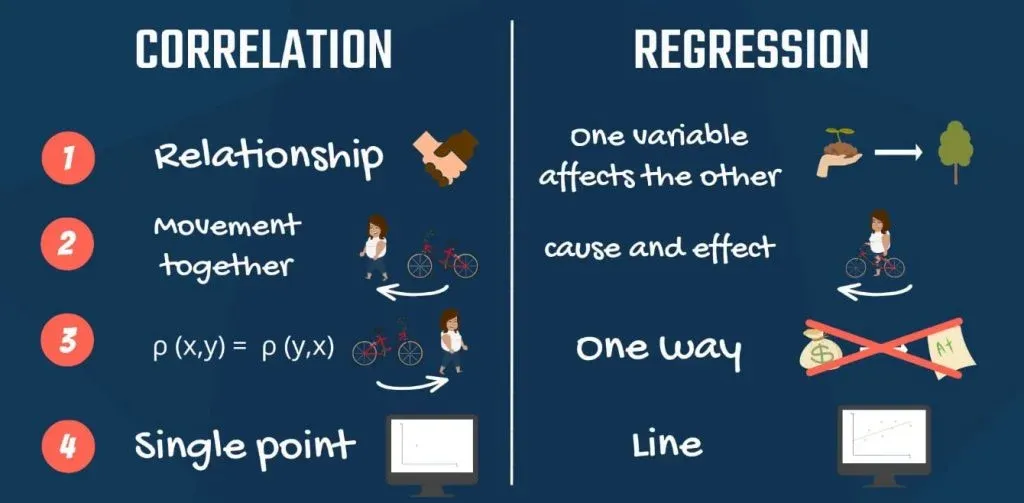
First, correlation measures the degree of relationship between two variables. Regression analysis is about how one variable affects another or what changes it triggers in the other.
For more on variables and regression, check out our tutorial How to Include Dummy Variables into a Regression.
2. Causality
Second, correlation doesn’t capture causality but the degree of interrelation between the two variables. Regression is based on causality. It shows no degree of connection, but cause and effect.
3. Are X and Y Interchangeable?
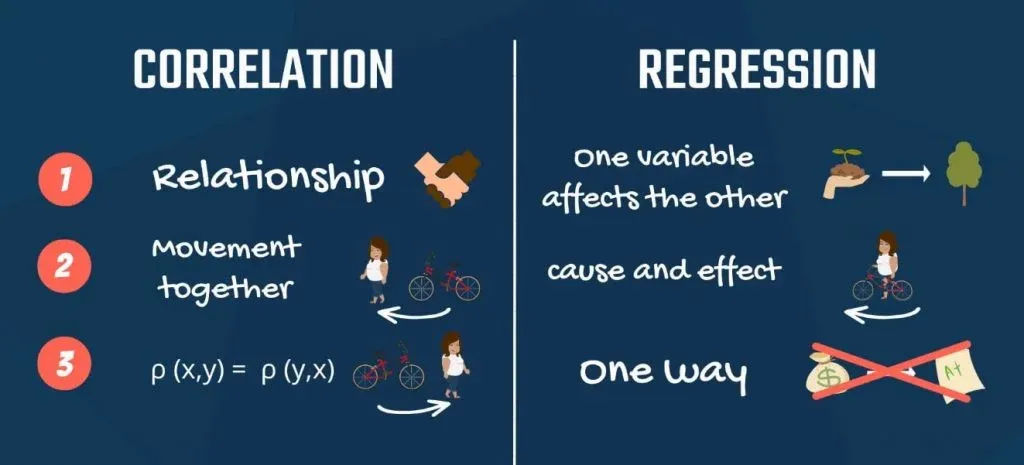
Third, a property of correlation is that the correlation between x and y is the same as between y and x. You can easily spot that from the formula, which is symmetrical. Regressions of y on x and x on y yield different results. Think about income and education. Predicting income, based on education makes sense, but the opposite does not.
4. Graphical Representation of Correlation and Regression Analysis
Finally, the two methods have a very different graphical representation. Linear regression analysis is known for the best fitting line that goes through the data points and minimizes the distance between them. Whereas, correlation is a single point.
Want to learn how to visualize statistical data? Check out our tutorials How to Visualize Numerical Data with Histograms and Visualizing Data with Bar, Pie and Pareto Charts.
Key Differences Between Correlation and Regression
To sum up, there are four key aspects in which these terms differ.
- When it comes to correlation, there is a relationship between the variables. Regression, on the other hand, puts emphasis on how one variable affects the other.
- Correlation does not capture causality, while regression is founded upon it.
- Correlation between x and y is the same as the one between y and x. Contrary, a regression of x and y, and y and x, yields completely different results.
- Lastly, the graphical representation of a correlation is a single point. Whereas, a linear regression is visualized by a line.
So, now that you have proof that correlation and regression are different, it is time for a new challenge. Find out how to decompose variability by diving into the linked tutorial.
***
Interested in learning more? You can take your skills from good to great with our statistics course! Try statistics course for free
Next Tutorial:
Sum of Squares Total, Sum of Squares Regression and Sum of Squares Error


