If you’ve always had a hard time figuring out how relationships work, covariance and the linear correlation coefficient will help you out. Well, not in the real world, of course. But in the field of statistics. We are talking about representing the relationship between 2 variables. See, there are many univariate measures which we can use when working with one variable. For instance, we have measures of central tendency, asymmetry and variability.
However, when we have 2 variables it is a whole new ball game. And because of that, learning how to work with covariance and the linear correlation coefficient, will be truly beneficial to your progress in studying statistics.

Understanding the Relationship between 2 Variables
Let’s zoom out a bit and think of an example that is very easy to understand. It will help us grasp the nature of the relationship between two variables a bit better.
Think about real estate. Which is one of the main factors that determine house prices?

Their size.
Typically, larger houses are more expensive, as people like having extra space.

The table that you can see in the picture below shows us data about several houses.

On the left side, we can see the size of each house. On the right, we have the price at which it’s been listed in a local newspaper.
Creating a Scatter Plot
We can present these data points in a scatter plot. The X-axis will show a house’s size and the Y-axis will provide information about its price.

We can certainly notice a pattern. There is a clear relationship between these variables.
We say that the two variables are correlated and the main statistic to measure this correlation is called covariance.

Unlike variance, covariance may be positive, equal to zero, or negative.

The Formulas for Covariance
To understand the concept better, let’s take a look at a few formulas. They will allow us to calculate the covariance between two variables. It is formulas with an ‘S’, because there is a sample and a population formula. The same way it is for variance.

Since this is obviously sample data, we should use the sample covariance formula. 
Let’s apply it in practice for the example that we saw earlier. X is the house size and Y stands for house price.
Applying the Sample Formula
First, we need to calculate the mean size and the mean price.
We can also compute the sample standard deviations, in case we need them later on.

Now, let’s calculate the nominator of the covariance function.
Starting with the first house, we can take the difference between its size and the average house size. Then, we will multiply that by the difference between the price of the same house and the average house price. You can see the result that we obtained in the picture below. 
Finding the Sum
Once we’re ready, we have to perform this calculation for all the houses that we have in the table. Then, we can proceed by summing the numbers we’ve obtained.

Our sample size is 5. Now we have to divide the sum by the sample size minus 1.

The Sign of the Covariance
The result you see above is the covariance.
It gives us a sense of the direction in which the two variables are moving.
- If they go in the same direction the covariance will have a positive sign.
- If they move in opposite directions the covariance will have a negative sign.
- Finally, if their movements are independent, the covariance between the house size and its price will be equal to zero.

The Problem
There is just one tiny problem with covariance, though. It could be a number like 5 or 50. But it can also be something like 0.0023456 or even over 30 million, just like our example!

Values of a completely different scale! How could we interpret such numbers?
Why We Need Correlation
This is where correlation comes into place.
It adjusts covariance so that the relationship between the two variables becomes easy and intuitive to interpret.
The formulas for the correlation coefficient are: the covariance divided by the product of the standard deviations of the two variables. This is either sample or population, depending on the data you are working with.

We already have the standard deviations of the two data sets.

Now, we’ll use the formula in order to find the sample correlation coefficient.
Putting the Formula to Use
Mathematically, there is no way to obtain a correlation value greater than 1 or less than -1.

This concept is similar. We manipulated the strange covariance value in order to get something intuitive.
Let’s examine it for a bit.
As shown in the picture below, by calculating the formula, we got a sample correlation coefficient of 0.87.
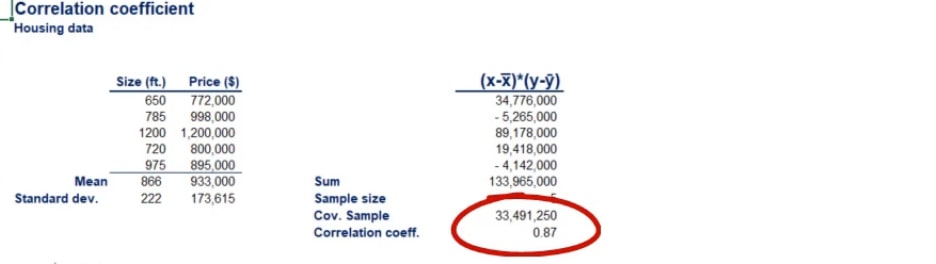
So, there is a strong relationship between the two values.
A Correlation of 1
A correlation of 1 is also known as a perfect positive correlation. This means that the entire variability of one variable is explained by the other.

However, logically, we know that size determines the price. On average, the bigger the house you build, the more expensive it will be.

The relationship goes only this way.

Once a house is built, if for some reason it becomes more expensive, its size doesn’t increase, although there is a positive correlation.
A Correlation of 0
A correlation of 0 between two variables means that they are absolutely independent of each other. For instance, we would expect a correlation of 0 between the price of coffee in Brazil and the price of houses in London.

Obviously, the two variables don’t have anything in common!
Negative Correlation
Finally, we can have a negative correlation coefficient. It can be a perfect negative correlation of -1 or much more likely an imperfect negative correlation of a value between -1 and 0.

Think of the following businesses - a company producing ice cream and a company selling umbrellas. Ice cream tends to be sold more when the weather is very good, and people buy umbrellas when it’s rainy. Obviously, there is a negative correlation between the two. Hence, when one of the companies makes more money, the other won’t.

Important: Before we continue, we must note that the correlation between two variables x and y is the same as the correlation between y and x.

The formula is completely symmetrical with respect to both variables.

Therefore, the correlation between price and size is the same as the one of size and price!
Causality
This leads us to causality. It is very important for any analyst or researcher to understand the direction of causal relationships. In the housing business, size determines the price and not vice versa.
Important: Correlation does not imply causation!

Representing the Relationship between 2 Variables
To sum up, using covariance and correlation is not rocket science. Based on the sign of the covariance, we can tell whether or not the 2 variables are moving in the same direction. However, this is not always possible because we can obtain values of an entirely different scale. Therefore, we turn to correlation. It makes the result of the covariance easy to interpret.
***
Interested in learning more? You can take your skills from good to great with our statistics course! Try statistics course for free
Next Tutorial: Examples of Different Distributions