The first thing to do when you start learning statistics is get acquainted with the data types that are used, such as numerical and categorical variables. Different types of variables require different types of statistical and visualization approaches. Therefore, it is crucial that you understand how to classify the data you are working with.
After reading this tutorial, you can start learning the appropriate statistics to perform different tests.
Moreover, you could use this knowledge as a stepping stone to a career in data science.
We've also made a video on the topic - you can watch it below or scroll down if you prefer reading.
Author's note: If you're wondering how to make data science your professional path, check out our articles: The Data Scientist Profile, How to Get a Data Science Internship, 5 Business Basics for Data Scientists, and, of course, Data Scientist Career Path: How to find your way through the data science maze.
Numerical and Categorical Types of Data in Statistics
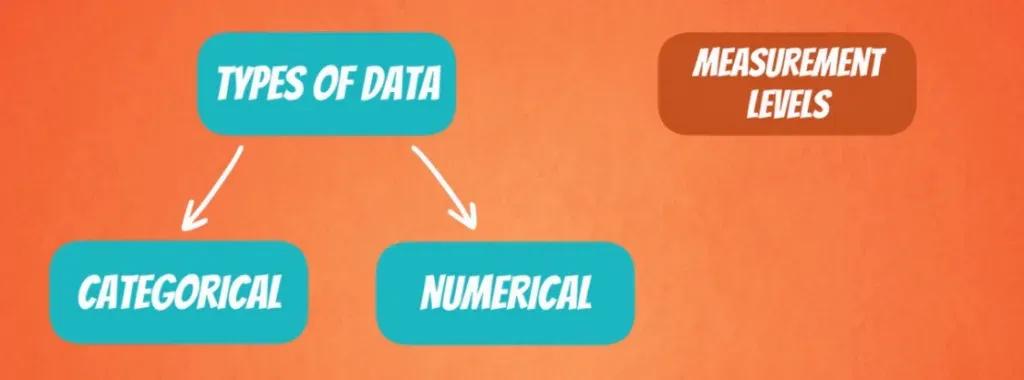
Now, let’s focus on classifying the data. We can do this in two main ways – based on its type and on its measurement levels.
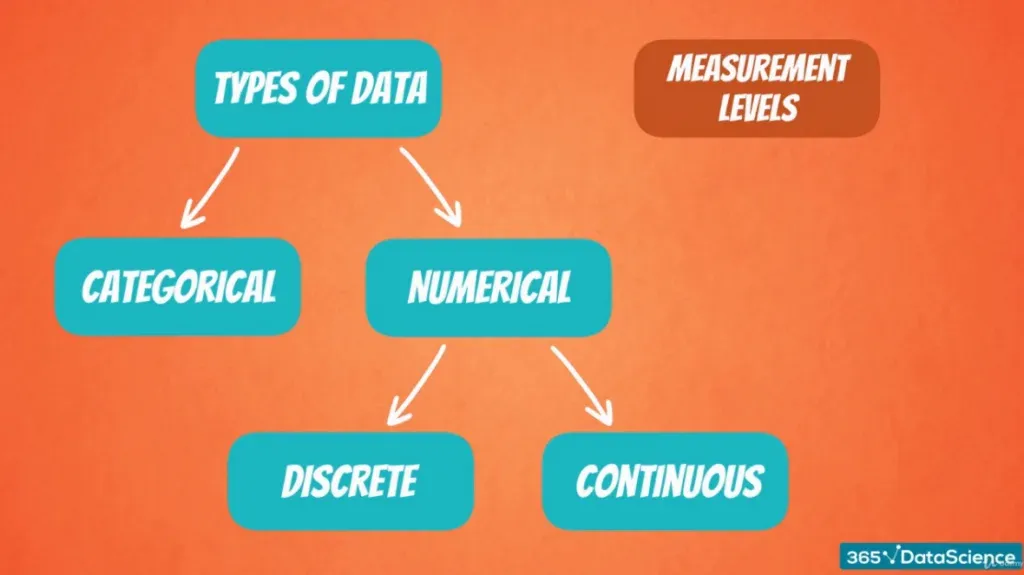
Let’s start with the types of data we can have: numerical and categorical.
The Categorical Variable
Categorical data describes categories or groups. One example would be car brands like Mercedes, BMW and Audi – they show different categories.
Another instance of categorical variables is answers to yes and no questions.
For example, if you are asked:
Are you currently enrolled in a university?
Or:
Do you own a car?
Yes and no would be the two groups of answers that can be obtained.
This is what you should know about categorical variables.
Numerical Variables
Numerical data, on the other hand, as its name suggests, represents numbers. It is further divided into two subsets: discrete and continuous.
Discrete Data
Discrete data can usually be counted in a finite matter.
Examples
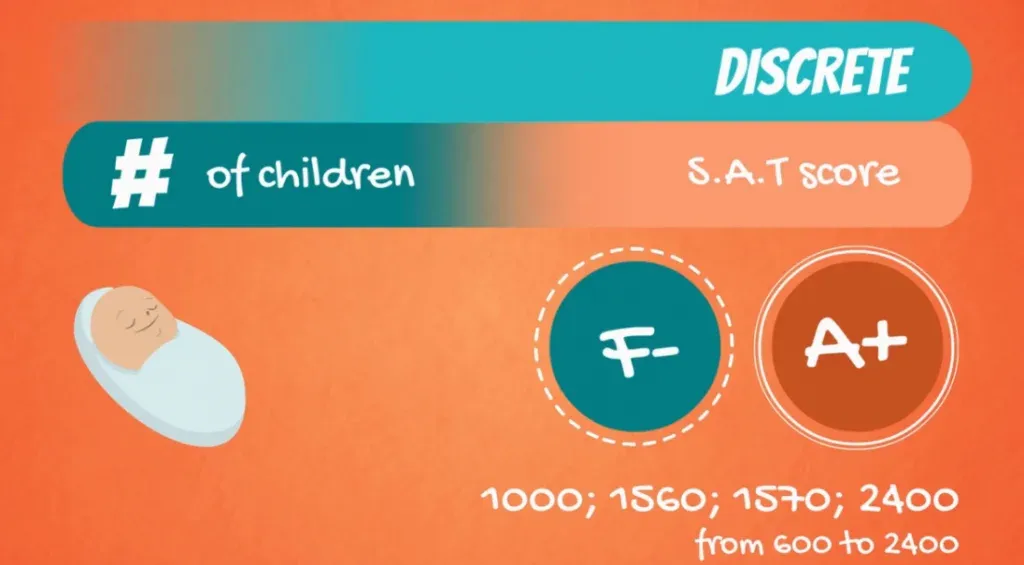
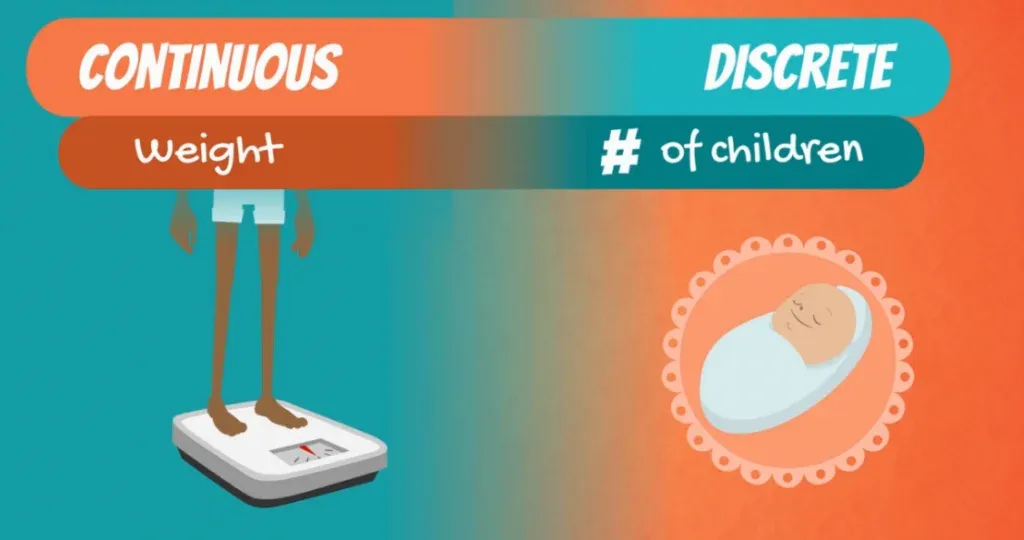
Take the number of children that you want to have. Even if you don’t know exactly how many, you are absolutely sure that the value will be an integer. So a number like 0, 1, 2, or even 10.
Another instance is grades on the SAT exam. You may get 1000, 1560, 1570 or 2400. What is important for a variable to be defined as discrete is that you can imagine each member of the dataset. We know that SAT scores range from 600 to 2400. Moreover, 10 points separate all possible scores that can be obtained. So, we can imagine and go through all possible values in our head. Therefore, the numerical variable is discrete.
Continuous Data
It’s easier to understand discrete data by saying it’s the opposite of continuous data. Continuous data is infinite, impossible to count, and impossible to imagine.
A Case in Point
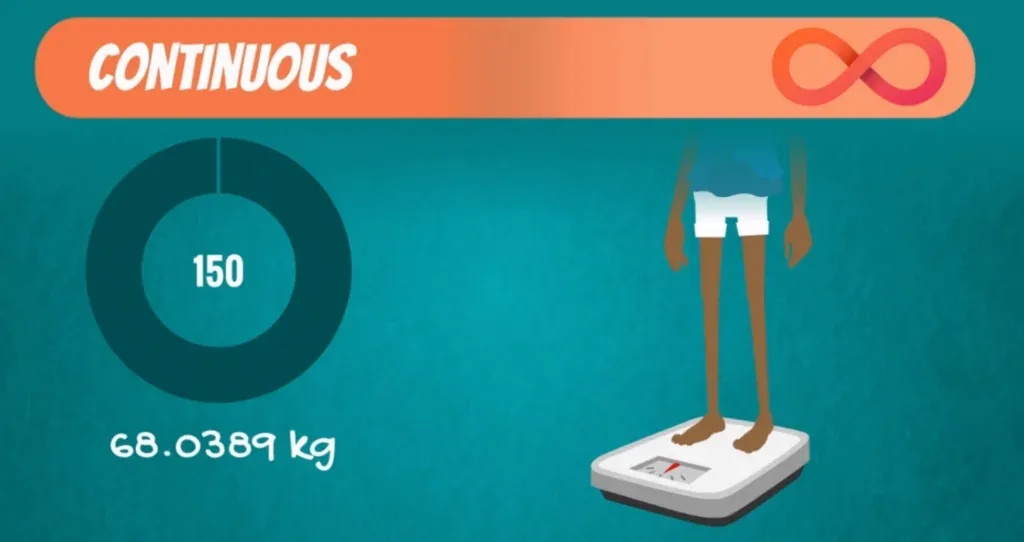
For instance, your weight can take on every value in some range.
Let’s dig a bit deeper into this.
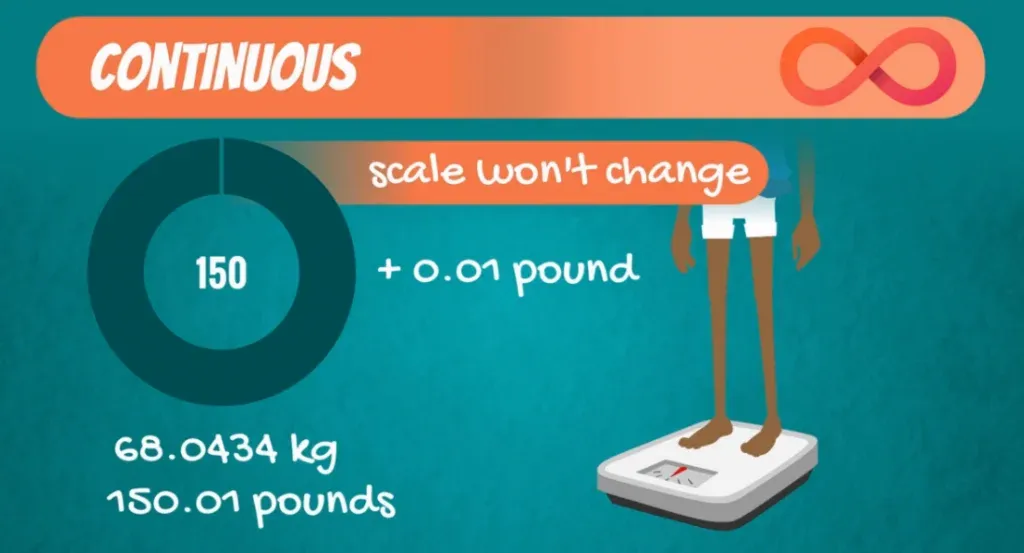
Say you get on the scale and the screen shows 150 pounds or 68.0389 kilograms.
But this is just an approximation.
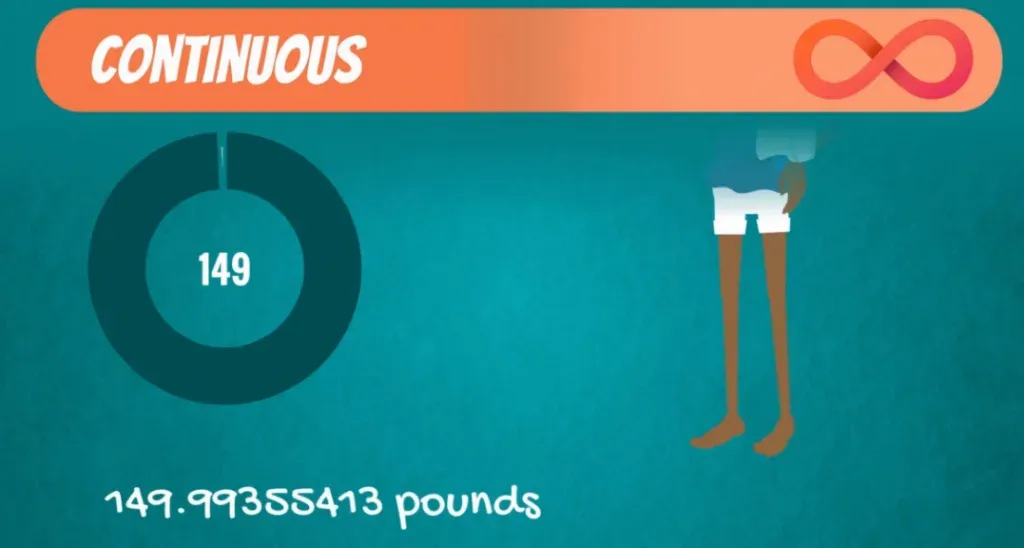
If you gain 0.01 pound, the figure on the scale is unlikely to change, but your new weight will be 150.01 pounds or 68.0434 kilograms.
Why Your Weight is a Continuous Variable
Now think about sweating. Every drop of sweat reduces your weight by the weight of that drop, but once again, a scale is unlikely to capture that change. The process of losing and gaining weight occurs all the time. Your exact weight is a continuous variable – it can take on an infinite amount of values no matter how many digits there are after the dot.
To sum up, your weight can vary by incomprehensibly small amounts and is continuous, while the number of children you want to have is directly understandable and is discrete.
More Examples of Discrete Data
Just to make sure – here are some other examples of discrete and continuous data:
- Grades at university are discrete – A, B, C, D, E, F, or 0 to 100 percent.
- The number of objects in general. No matter if bottles, glasses, tables, or cars. They can only take integer values
- Money can be considered both, but physical money like banknotes and coins are definitely discrete. You can’t pay \$1.243. You can only pay \$1.24. That’s because the difference between two sums of money can be 1 cent at most.
More Examples of Continuous Data
What else is continuous?
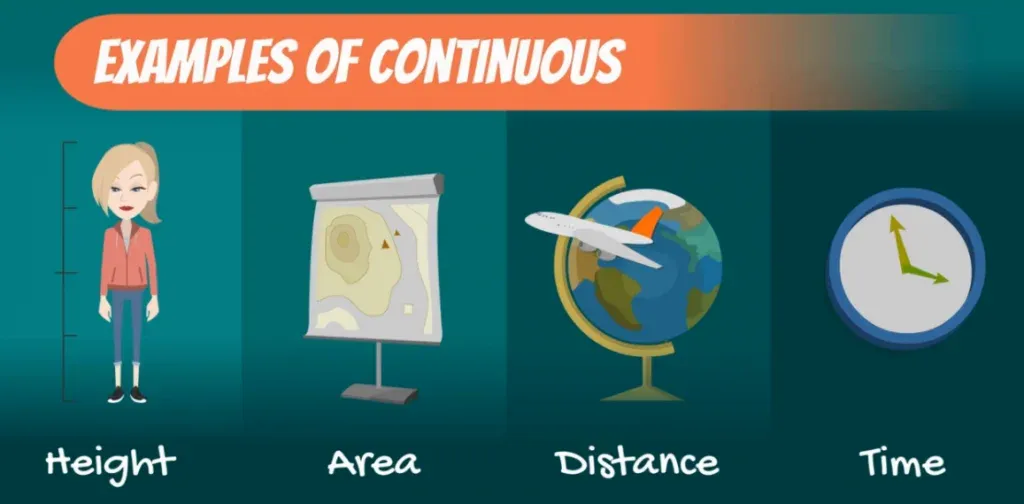
Apart from weight, other measurements that are also continuous are:
- Height
- Area
- Distance
- Time
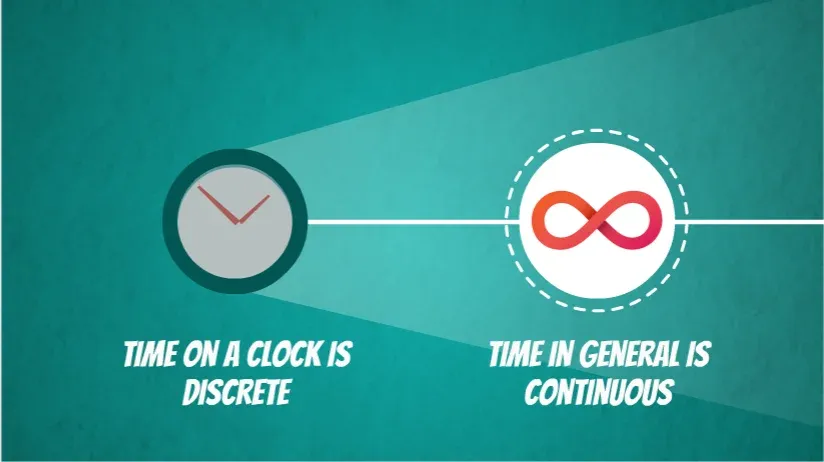
All of these can vary by infinitely smaller amounts, incomprehensible for a human. Time on a clock is discrete, but time, in general, isn’t! It can be anything like 72.123456 seconds.
We are constrained when measuring weight, height, area, distance, and time by our technology, but in general, they can take on any value.
Difference Between Numerical and Categorical Variables
So, these were the types of data. We gave examples of both categorical variables and the numerical variables. Furthermore, we explained the difference between discrete and continuous data. Once again, you were flooded with examples so that you can get a better understanding of them.
If you remember, we mentioned that there are 2 ways of classifying data. In this tutorial, we only explored the first one. If you want to find out how to classify data based on its measurement level, continue to the next tutorial.
***
Interested in learning more? You can take your skills from good to great with our statistics course!
Try statistics course for free
Next Tutorial: Levels of Measurement

