Connecting data sources is an easy task in Tableau. The program’s intuitive interface helps create interactive visuals using data from multiple sources in an intuitive manner. Ready for some action?
Once we have downloaded Tableau Public, it is time to load our data. First off, we need to learn how to connect Tableau to the data source we will be working with.
In this example, we will load Excel data. Tableau is a great complement for Excel, and a competent analyst would love to work with both tools.
First off, we need to select a data source
There are two options – we can either create a connection to a file or a server. Of course, we’ll choose one of the two depending on where our data is.
Let’s connect Tableau to a Microsoft Excel file. In general, every time we use a source file in one of our tutorials, we will provide a link where you could easily download it.
In this case, we will use a file called ‘GDP data’. Click here to download it.
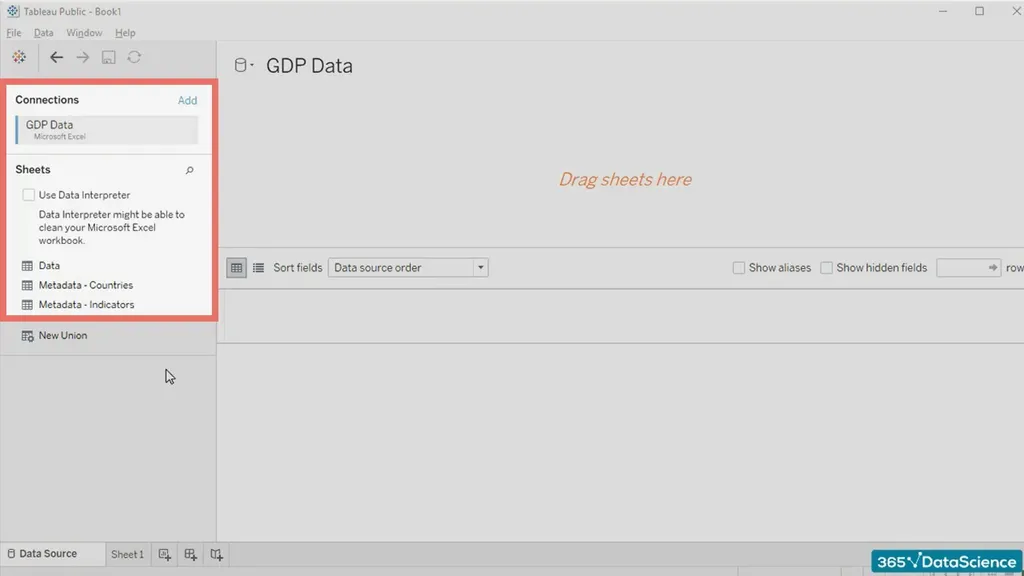
Under “connections”, I can now see that Tableau opened the file.
Get a taste of the amazing drag-and-drop interface of Tableau
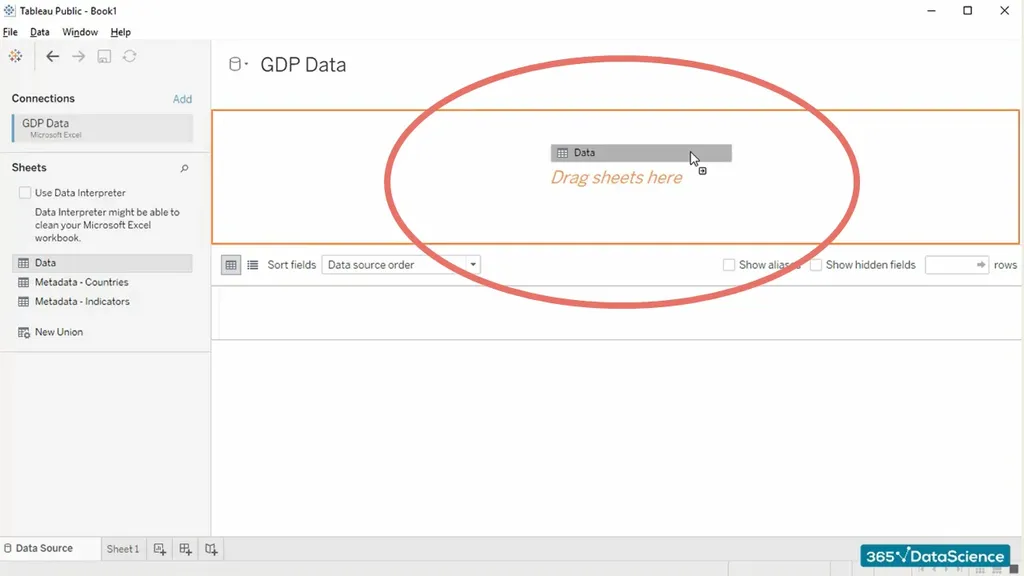
Our source includes three sheets – 'Data', 'Metadata – Countries', and 'Metadata – Indicators'. What we usually have to do is choose the worksheet we’ll need and drag into the upper part of the screen where 'Drag sheets here' is written.
Connecting data sources: How to use the Data Interpreter function
Once we do that Tableau is going to activate the sheet we selected and provide us with a preview of the data we have inside.
The first two rows of the sheet are empty and hence we see all of these 'null' values.
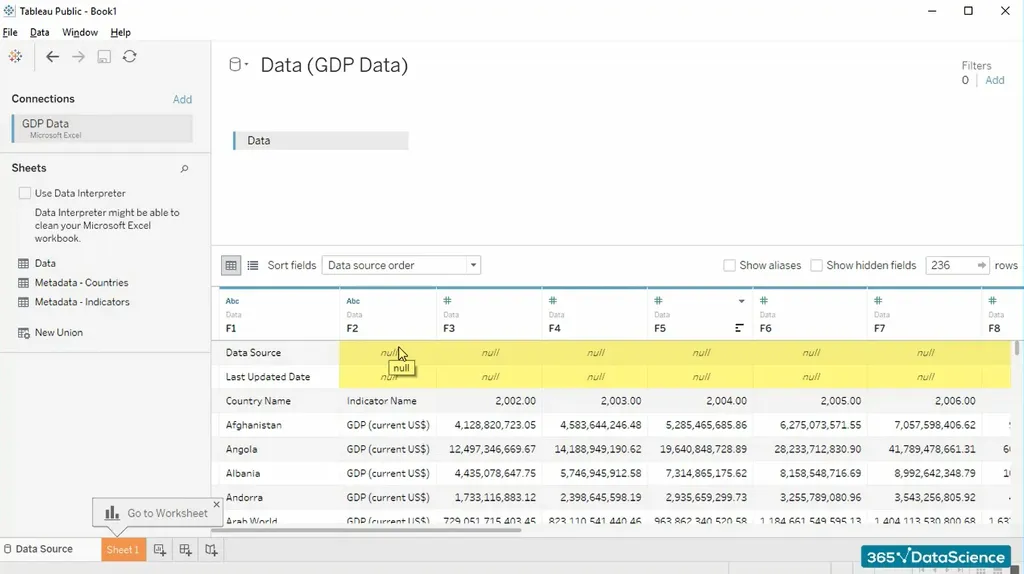
Tableau is really smart and can often help us with similar issues. As you can see here, the program suggests using its 'Data Interpreter' functionality to clean the data. And... voila! The first two rows containing null values disappeared.
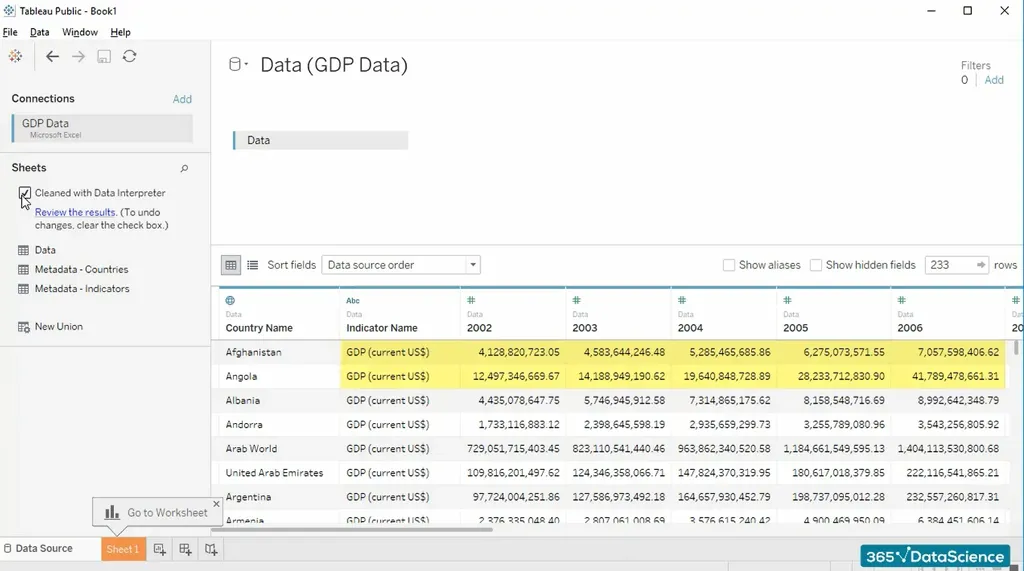 This is how we connect data sources in Tableau.
In our next tutorial, we will show you how to navigate the Tableau interface. See you there!
***
If you want to sharpen your visualization skills, find some extra helpful resources in our Tableau tutorials and Tableau course.

