This lesson will introduce you to the three measures of central tendency. Don’t be scared by the terminology; we are talking about mean, median and mode. Even if you are familiar with these terms from our tutorial Introduction to the Measures of Central Tendency, please stick around, as we will explore their upsides and shortfalls. Ready? Let’s go.
The first measure we will study is the mean, also known as the simple average. It is denoted by the Greek letter mu for a population and x bar for a sample. These notions will come in handy in the next section.
We can find the mean of a data set by adding up all of its components and then dividing them by the number of components contained in the data set. The mean is the most common measure of central tendency but it has a huge downside – it is easily affected by outliers.
Let’s compare these two data sets.
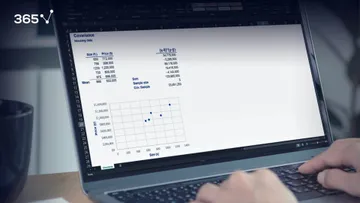
These are the prices of pizza at 11 different locations in New York City and 10 different locations in LA. Let’s calculate the means of the two datasets using the formula. For the mean in NYC, we get 11 dollars, whereas for LA - just 5.5! On average, pizza in New York can’t be twice as expensive as in LA, right? Correct. The problem is that in our sample, we have included one posh place in New York, where they charge 66 dollars for pizza, and this doubled the mean. What we should take away from this example is that the mean is not enough to make definite conclusions.
So, how can we protect ourselves from this issue? You guessed it, we can calculate the second measure – the median. The median is basically the ‘middle’ number in an ordered data set. Let’s see how it works for our example. In order to calculate the median, we have to order our data in ascending order. The median of the data set is the number at position n plus 1, divided by two in the ordered list, where n is the number of observations. Therefore, the median for NYC is at the sixth position or \$6. Much closer to the observed prices than the mean of \$11, right?
What about LA? We have just 10 observations in LA. According to our formula, the median is at position 5.5. In cases like this, the median is the simple average of the numbers at positions 5 and 6. Therefore, the median of LA prices is 5.5 dollars.
Okay, we have seen that the median is not affected by extreme prices,
which is good when we have posh New York restaurants in a street pizza sample. But we still don’t get the full picture. Are the majority of restaurants low cost or average?
We must introduce another measure – the mode. The mode is the value that occurs most often. It can be used for both numerical and categorical data, but we will stick to our numerical example. After counting the frequencies of each value, we find that the mode of New York pizza prices is 3 dollars. Now, that’s interesting! The most common price of pizza in NYC is just 3 dollars, but the mean and median led us to believe it was much more expensive.
Ok, let’s do the same and find the mode of LA pizza prices. Hmm… each price appears only once. How do we find the mode then? Well, we say that there is no mode.
But can’t I say that there are 10 modes, you may ask? Sure you can, but it will be meaningless with 10 observations and an experienced statistician would never do that. In general, you often have multiple modes. Usually two or three modes are tolerable, but more than that would defeat the purpose of finding a mode.
Now, is there a quicker way to calculate these measures of central tendency? Yes, there is—with our Mean, Median, Mode Calculator, you can simply input your data to obtain the results you need in just a few clicks.
What's the Best Measure of Central Tendency?
There is one last question that we haven’t answered yet. Which measure is best? The NYC and LA example shows us that measures of central tendency should be used together rather than independently. Therefore, there is no best, but using only one is definitely the worst.
Eager to learn more statistics? Take our Statistics course.
You can also check out our tutorials on Types of Data, Skewness, Standardization, and Measures of Variability or go straight to Performing a Linear Regression in Python.
And, if you're interested in learning data science, feel free to check out the 365 Complete Data Science Training.
Next Video: Levels of Measurement in Statistics