
Market basket analysis is a powerful data science application that improves user experience and encourages purchases, which adds direct business value to companies.
In the past, marketers would often use their intuition when creating product combinations and building marketing strategies. Now that organizations are able to collect and store more data than ever before, they use their findings to target customers and increase sales. They hire data scientists and analysts in marketing teams to make these decisions instead.
In this article, I will explain some of the theory behind market basket analysis and show you how to implement it in Python.
Table of Contents
- What Is Market Basket Analysis?
- How Does Market Basket Analysis Work?
- How to Perform Market Basket Analysis in Python?
- Market Basket Analysis in Python: Next Steps
What Is Market Basket Analysis?
Market basket analysis is used by companies to identify items that are frequently purchased together. Notice, when you visit the grocery store, how baby formula and diapers are always sold in the same aisle. Similarly, bread, butter, and jam are all placed near each other so that customers can easily purchase them together. The technique uncovers hidden correlations that cannot be identified by the human eye by using a set of statistical rules to identify product combinations that occur frequently in transactions.
Apart from market basket analysis, other popular applications of data science in marketing include churn prediction, sentiment analysis, customer segmentation, and recommendation systems.
How Does Market Basket Analysis Work?
Market basket analysis is frequently used by restaurants, retail stores, and online shopping platforms to encourage customers to make more purchases in a single visit. This is a use-case of data science in marketing that increases company sales and drives business growth and commonly utilizes the Apriori algorithm.
What is the Apriori Algorithm?
The Apriori algorithm is the most common technique for performing market basket analysis.
It is used for association rule mining, which is a rule-based process used to identify correlations between items purchased by users.
How Does the Apriori Algorithm Work?
Let’s explore the process through an example of items most frequently bought together in a given store:

Most store customers have purchased popcorn, milk, and cereal together. Therefore, {popcorn, milk, cereal} is a frequent itemset as it appears in a majority of purchases. So, if a person grabs popcorn and milk, they will also be recommended cereal.
According to the Apriori algorithm, a subset of the frequent itemset is also frequent. Since {popcorn, milk, cereal} is a frequent itemset, this means that {popcorn, milk}, {popcorn, cereal}, and {milk, cereal} are also frequent. Due to this, if a customer only goes for popcorn, they will be recommended both milk and cereal as well.
What Are the Components of the Apriori Algorithm?
The Apriori algorithm has three main components:
- Support
- Lift
- Confidence
You can think of these as metrics that evaluate the relevance and popularity of each item combination.
Let’s illustrate. The baskets below contain items purchased by four customers at a grocery store:

Here is a tabular representation of this purchase data:
|
|
Milk |
Beer |
Eggs |
Bread |
Bananas |
Apples |
|
Basket 1 |
1 |
1 |
1 |
1 |
0 |
0 |
|
Basket 2 |
1 |
0 |
0 |
1 |
0 |
0 |
|
Basket 3 |
1 |
0 |
0 |
1 |
0 |
1 |
|
Basket 4 |
0 |
0 |
0 |
1 |
1 |
1 |
Let’s calculate the support, confidence, and lift.
Support
The first component of the Apriori algorithm is support – we use it to assess the overall popularity of a given product with the following formula:
Support(item) = Transactions comprising the item / Total transactions
In the purchase data we’re working with, we have support(milk) = ¾ = 0.75. This means that milk is present in 75% of all purchases.
Similarly, we have support(bread) = 4/4 = 1. This means that bread is present in 100% of purchases.
A high support value indicates that the item is present in most purchases, therefore marketers should focus on it more.
Confidence
Confidence tells us the likelihood of different purchase combinations. We calculate that using the following formula:
Confidence (Bread -> Milk) = Transactions comprising bread and milk / Transactions comprising bread
In this case, it can show how many users who purchased bread also bought milk:
Confidence (Bread -> Milk) = ¾ = 0.75
This means that 75% of the customers who bought bread also purchased milk.
Lift
Finally, lift refers to the increase in the ratio of the sale of milk when you sell bread:
Lift = Confidence (Bread -> Milk) / Support(Bread) = 0.75/1 = 1.3.
This means that customers are 1.3 times more likely to buy milk if you also sell bread.
<h2id="3">How to Perform Market Basket Analysis in Python?
Now that you understand how the Apriori algorithm works, let us perform market basket analysis in Python using Kaggle’s Grocery Dataset.
Step 1: Pre-Requisites for Performing Market Basket Analysis
Download the dataset before you start coding along with this tutorial.
Make sure you also have Jupyter Notebook installed on your device. If you are unfamiliar with the software, follow 365’s beginner-friendly Jupyter Notebook tutorial or Introduction to Jupyter course to learn about its usage and installation.
Finally, install the pandas and MLXtend libraries if you haven’t already.
Step 2: Reading the Dataset
Now, let’s read the dataset as a pandas data frame and take a look at its head:
import pandas as pd

df = pd.read_csv('Groceries_dataset.csv')
df.head()
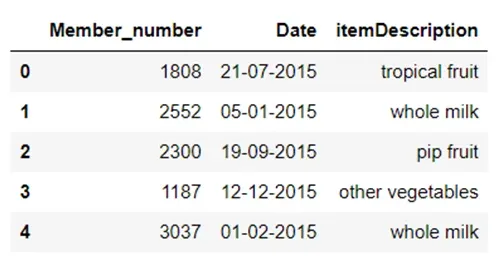
It contains information on purchases made at a grocery store, including the transaction date, item description, and a unique customer ID. We will use this data frame to perform market basket analysis and identify item combinations that are frequently bought together.
Step 3: Data Preparation for Market Basket Analysis
Before we perform market basket analysis, we need to convert this data into a format that can easily be ingested into the Apriori algorithm. In other words, we need to turn it into a tabular structure comprising ones and zeros, as displayed in the bread and milk example above.
To achieve this, the first group items that have the same member number and date:
df[‘single_transaction’] = df[‘Member_number’].astype(str)+’_’+df[‘Date’].astype(str)

df.head()
This will provide us with a list of products purchased in the same transaction:
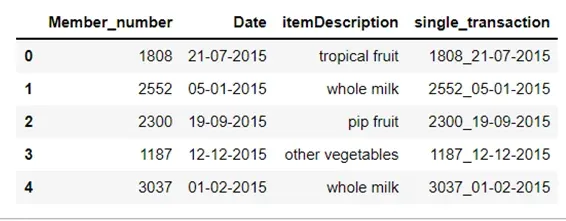
The “single_transaction” variable combines the member number, and date, and tells us the item purchased in one receipt.
Now, let’s pivot this table to convert the items into columns and the transaction into rows:
df2 = pd.crosstab(df['single_transaction'], df['itemDescription'])
df2.head()
The resulting table tells us how many times each item has been purchased in one transaction:

There are over a hundred columns while most people only shop for 2-3 items, which is why this table is sparse and mostly comprised of zeroes.
The final data pre-processing step involves encoding all values in the above data frame to 0 and 1.
This means that even if there are multiples of the same item in the same transaction, the value will be encoded to 1 since market basket analysis does not take purchase frequency into consideration.
Run the following lines of code to achieve the above:
def encode(item_freq):
    res = 0
    if item_freq > 0:
        res = 1
    return res

basket_input = df2.applymap(encode)
Step 4: Build the Apriori Algorithm for Market Basket Analysis
Now, let’s import the Apriori algorithm from the MLXtend Python package and use it to discover frequently-bought-together item combinations:
from mlxtend.frequent_patterns import apriori
from mlxtend.frequent_patterns import association_rules

frequent_itemsets = apriori(basket_input, min_support=0.001, use_colnames=True)

rules = association_rules(frequent_itemsets, metric="lift")

rules.head()
You should get a table that looks like this:

Here, the “antecedents” and “consequents” columns show items that are frequently purchased together.
In this example, the first row of the dataset tells us that if a person were to buy bottled water, then they are also likely to purchase UHT-milk.
To get the most frequent item combinations in the entire dataset, let’s sort the dataset by support, confidence, and lift:
rules.sort_values(["support", "confidence","lift"],axis = 0, ascending = False).head(8)
The resulting table shows that the four most popular product combinations that are frequently bought together are:
- Rolls and milk
- Yogurt and milk
- Sausages and milk
- Soda and vegetables
One reason for this could be that the grocery store ran a promotion on these items together or displayed them within the same line of sight to improve sales.
Q&A
Market Basket Analysis in Python: Next Steps
Market basket analysis is a useful skill to have in your data science arsenal as it’ll not only help you on the job but also impress employers at the interviewing stage.
And if your goal is to become a data scientist in the field of marketing, then you must be able to solve business problems using customer data. You should also be comfortable with programming and statistics and must be able to analyze large amounts of data to generate actionable insights.
Gain more insight with 365’s Customer Analytics in Python course where you will learn to perform tasks such as predicting user purchase behavior, completing the purchase cycle, and building customer segmentation models. This is a great course for you to gain marketing domain knowledge and hone your data science skills. Sign up below to access a selection of lessons for free – this is a great way to see if our training is the right fit for you!