KPIs and metrics are often used interchangeably. And while they’re similar, there are some key distinctions between them. Knowing the difference will help you align measures with strategic goals and turn your company into a data-driven business.
Below, we explain in detail the meaning of each term. We juxtapose KPI vs. metric and show you how to use them to evaluate business performance.
Watch our video for a quick overview of the topic, and read on for more detailed guidelines on measuring performance.
KPI vs. Metric: Table of Contents
- What Is a Metric?
- What Are KPIs?
- KPIs vs. Metrics: What Is the Difference?
- How to Measure Performance
- Next Steps
What Is a Metric?
Performance metrics allow companies to compare their performance to that of their peers and world-class organizations. If selected appropriately, they can help decision-makers capture the current state of their business and potential risks and opportunities.
Their goal is to provide a quick insight into trends and help management to monitor performance, enact changes, and measure the success of different strategies and activities.
We can classify metrics in several ways.
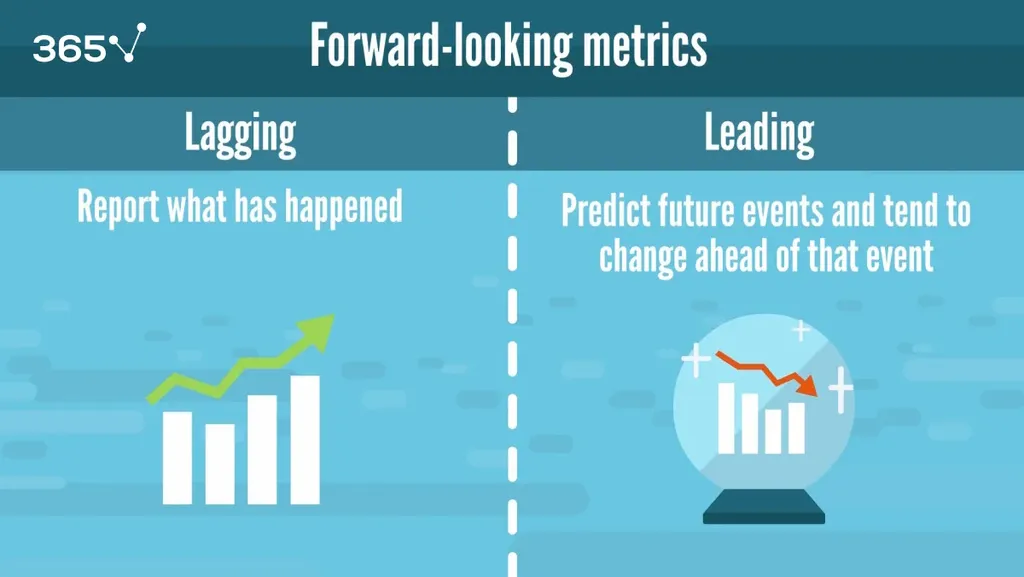
They can be lagging or leading, depending on whether they measure the past or aim to predict the future. We use lagging metrics to report what has happened and leading indicators to predict future performance. We adjust the latter based on newly available information, so they often change ahead of the event they’re tied to.
An example of a leading metric is the employee engagement score, which we can use to predict employee retention rates. Highly engaged employees perform better, so the risk of losing them is lower. A lagging metric, on the other hand, has little predictive power. For instance, we can measure personnel cost as a percentage of revenues to see how much we’ve spent on this. Sure, we can use this information to adjust future costs, but the metric itself doesn’t reveal anything about the future.

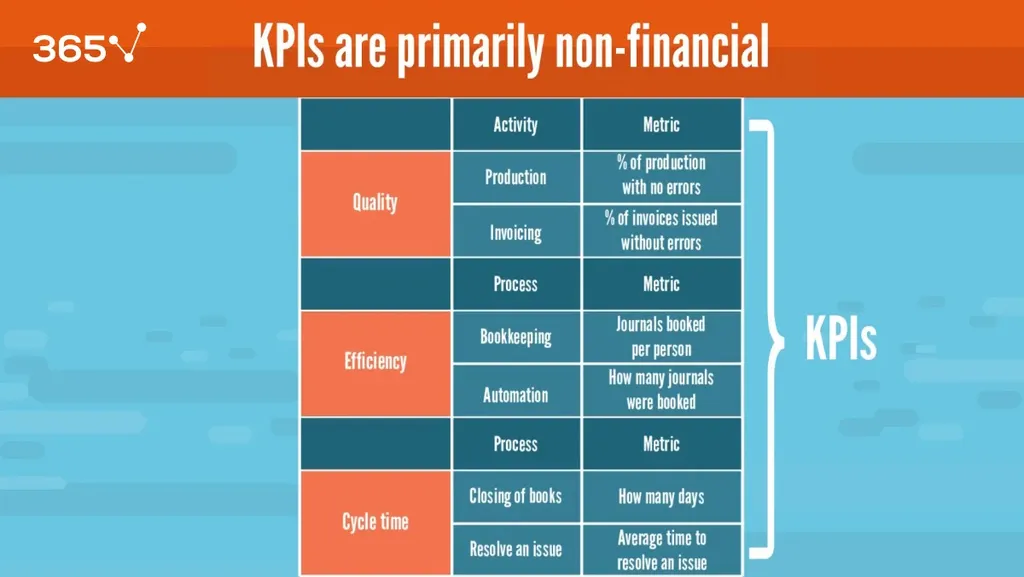
Additionally, we can split the types of metrics into cost, quality, efficiency, and cycle time based on what aspect of performance we want to measure.
Cost metrics indicate the percentage of our total budget spent on an activity—e.g., research and development. Quality metrics track how well specific actions are performed, which could be the percentage of products produced with no errors.
Efficiency metrics reveal the productivity of the organization, a given department, or a process. Suppose we want to track an accounting’s department efficiency; we could measure the number of journal entries per person.
Another type of metric is cycle time, which indicates how long it takes to run a process—e.g., resolve a raised issue. Finally, some general metrics—such as engagement score, attrition rate, and customer satisfaction score—don’t fall under a specific category but are still important.
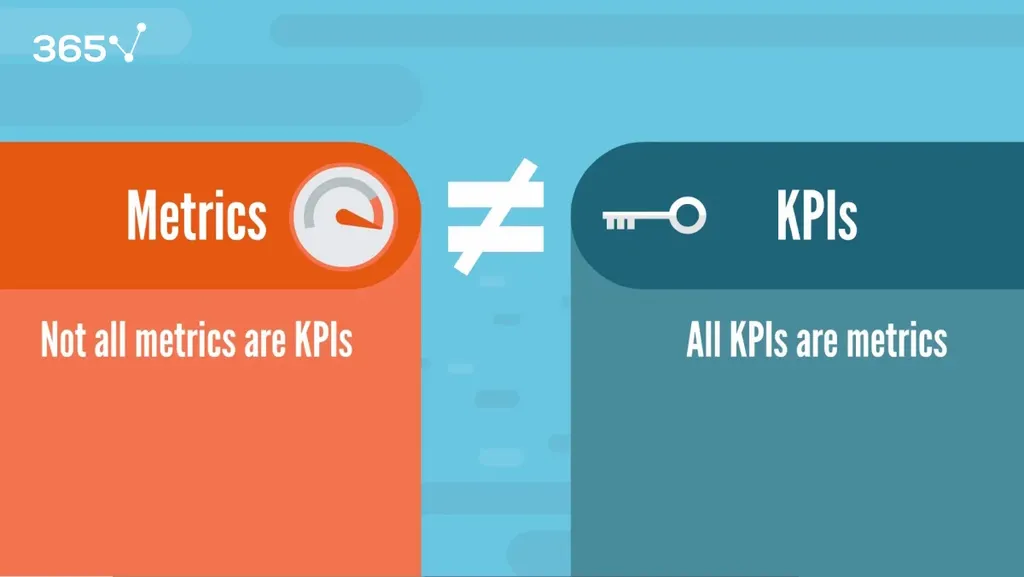
As you can see, the term metrics encompasses many measures. Before we define KPI, remember that KPIs are a type of metric. All KPIs are metrics, but not all metrics are KPIs.
What Are KPIs?
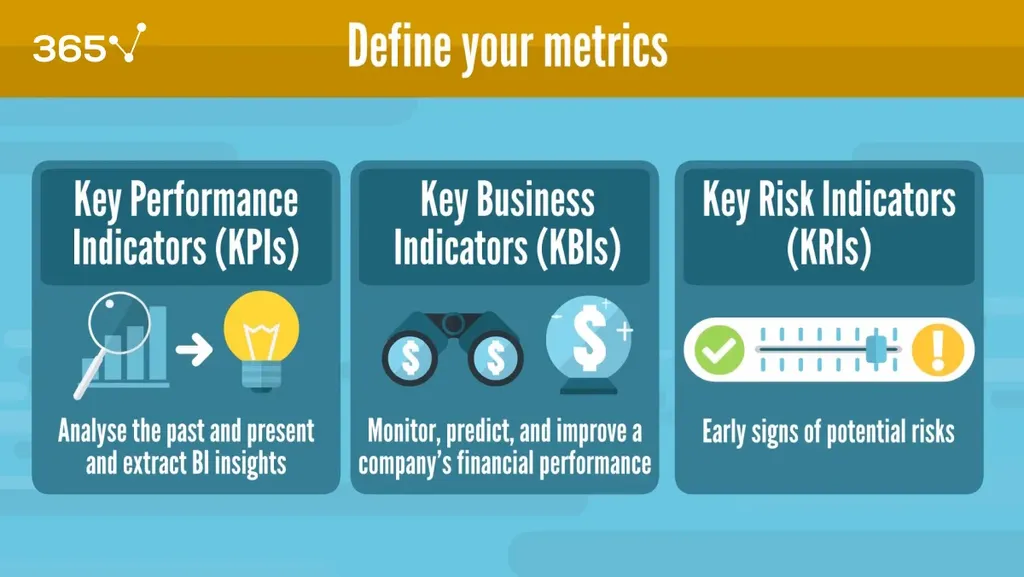
Key performance indicators (KPIs) are primarily non-financial and process-oriented. Simply put, they aim to analyze past and present data to extract business insights about the future. As such, they are considered leading metrics.
Quality, efficiency, and cycle time metrics are KPIs. For example, if your goal is to increase the accuracy of your billing department, you can measure the percentage of invoices without errors to track your progress.

On the other hand, cost metrics can be categorized as key business indicators (KBIs), which include labor cost as a percentage of spending, R&D as a percentage of revenues, etc. KBIs are primarily financial. They aim to monitor, predict, and improve financial performance.
You may also encounter the term key risk indicators (KRIs), which measure the risk level of a specific activity. Ideally, these metrics give you an early warning regarding potentially harmful situations for your company’s performance.
You can measure internal and external risks. An example of the latter is political unrest in the Middle East, leading to higher oil prices, which significantly impact your cost base and overall profitability. Predicting potential risks can help you take precautions or even prevent adverse effects.

Hopefully, now you can distinguish between the types of key metrics. Let’s continue with the KPIs vs. metrics comparison.
KPIs vs. Metrics: What Is the Difference?
What is the primary difference between a metric and a KPI? All KPIs are metrics, but not all metrics are KPIs.

KPIs are primarily non-financial and measure quality, efficiency, and cycle time. Metrics include a much larger scope of measures. In addition, KPIs are always linked to the company’s strategic goals. As such, they are the best choice when measuring progress. Metrics, on the other hand, may not be tied to a specific objective. Still, that doesn’t mean they aren’t helpful.
On the contrary, metrics provide the tools to track performance over various dimensions and time frames. They’re ideal for monitoring daily operations and the success of concrete actions. You can get as granular as you want in your measurements, and then present a selected subset to different stakeholders.
Despite the differences, the two concepts aren’t mutually exclusive. Quite the opposite—they complement each other. For one thing, you must select the right metrics to ensure your KPIs are linked to the business’s goals. KPIs help you move in the right direction, while metrics fine-tune the ongoing strategies.
Ultimately, KPIs will appear in your annual report to demonstrate your progress toward achieving the company’s strategic objectives. But metrics keep you on the right track throughout the year.
Let’s see a KPIs vs. metrics example to make the distinctions clearer.
Imagine you’re a bookstore chain owner and one of your business objectives is to increase sales by 15% in one year. A relevant KPI to measure the progress toward your goal would be year-over-year sales growth. This will reveal whether you achieved your goal but won’t tell you why you succeeded or failed.
So, you might complement your measurement with some metrics to fine-tune your strategy. These metrics will help you identify areas for improvement and adjust your strategies in real-time. For example, you can track employees’ productiveness in different stores, the time of day with the most sales, the bestseller genre, and so on.
As you can see, KPIs and metrics are equally important, even though they serve different purposes. Knowing the distinction is the first step toward successfully measuring business performance. What else do you need to consider when choosing your metrics?
How to Measure Performance
Data-driven businesses rely on KPIs and metrics to derive helpful insights. More prominent companies may have the resources to hire a business analyst and a data analyst to select and track the right metrics.
Typically, the business analyst is responsible for aligning KPIs with goals. They communicate the obtained insights to stakeholders and advise decision-makers on the course of action. Meanwhile, data analysts clean, analyze, and visualize the data to measure and present the KPIs and metrics.
Nonetheless, data science roles often overlap. Depending on the company’s size and resources, these responsibilities may be in the hands of one person—the business analyst, data analyst, data scientist, or even management and decision-makers.
Regardless of your role, selecting metrics and KPIs is a responsible task. The art of finding the appropriate metrics lies within several essential factors.
We measure performance to drive efficiency and effectiveness for a given function, operating unit, or company. But how do we choose the most suitable metrics? The following framework offers helpful guidelines:
- Concise: Can the measure be quickly and clearly explained?
- Calculated: Can the measure be quantified?
- Capable: Is the metric attainable?
- Connected: Can the key performance indicator be aligned with an objective?
- Controllable: Can the results be controlled or significantly influenced?
- Credible: Is the measure resistant to manipulation?
- Cascaded: Can the KPI be cascaded throughout the organization to drive behavior?
- Consistent: Is the KPI measured consistently throughout the organization?
In addition, we must come up with a good mixture between leading and lagging metrics for different stakeholders, departments, and levels of detail. Some metrics should be measured daily; others can be quarterly.
More importantly, we need to benchmark for all this information to make sense. This means comparing the metric against the previous period, the budget, the forecast, or an external benchmark.
Metrics must bring real-time visibility, transparency, accountability, and actionable intelligence to your organization's management team. Instead of throwing hundreds of metrics in their direction, it’s much better to introduce several or a dozen that are useful and monitored constantly.
How do we narrow the choice?
The best course of action is to build a metrics structure via the following steps:
- Determine what you want to measure;
- Choose the KPIs relevant to your goals and the metrics to support them;
- Determine the frequency of delivery and level of detail depending on who you will report to;
- Decide what to benchmark against—other companies, industry benchmarks, or past performance);
- Set targets per metric (weekly, monthly, or yearly);
- Derive meaningful conclusions from the results considering each metric’s limitations.
We can track and predict multiple aspects related to the company’s or a single department’s performance. But we should select them in a way that reflects a balanced perspective across the critical elements of the business.
Next Steps
Knowing the KPI vs. metric distinction helps streamline the business strategy. KPIs provide an overall direction, aligning measures with goals, while the metrics guide daily decisions and operations.
We’ve provided helpful guidelines on choosing the proper measures for your company performance above. If you want to perfect the art of finding and tracking the appropriate metrics to drive business growth, take our Mastering Key Performance Metrics (KPIs) course. You can also enroll in our Introduction to Business Analytics course to learn how to use data-driven decision-making as a tool for success.
Our Business Analyst Career Track will take your skills to the next level and transform you into a certified business analytics expert. You can sign up via the link below and try the 365 Data Science learning program for free.


