Welcome! Would you like to better understand the difference between traditional and big data, where to find the data and what techniques you can use to process it?
Excellent! Because that’s what this article has set out to do. These are the first steps you must take when dealing with data, so it’s a wonderful place to start, especially if you're considering a career in data science!
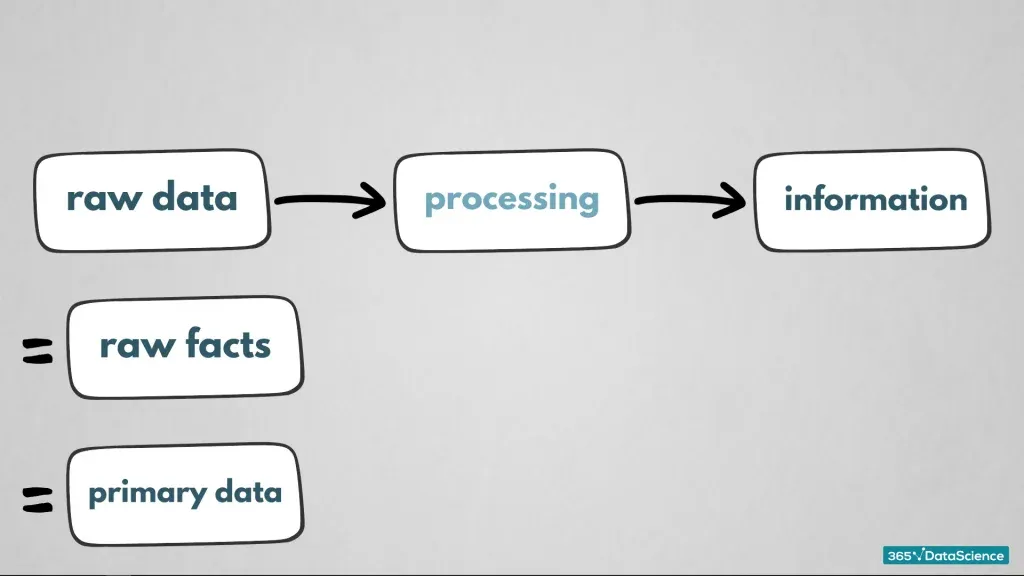
‘Data’ is a broad term that can refer to ‘raw facts’, ‘processed data’ or ‘information’. To make sure we’re on the same page, let’s separate them before we get into the details.
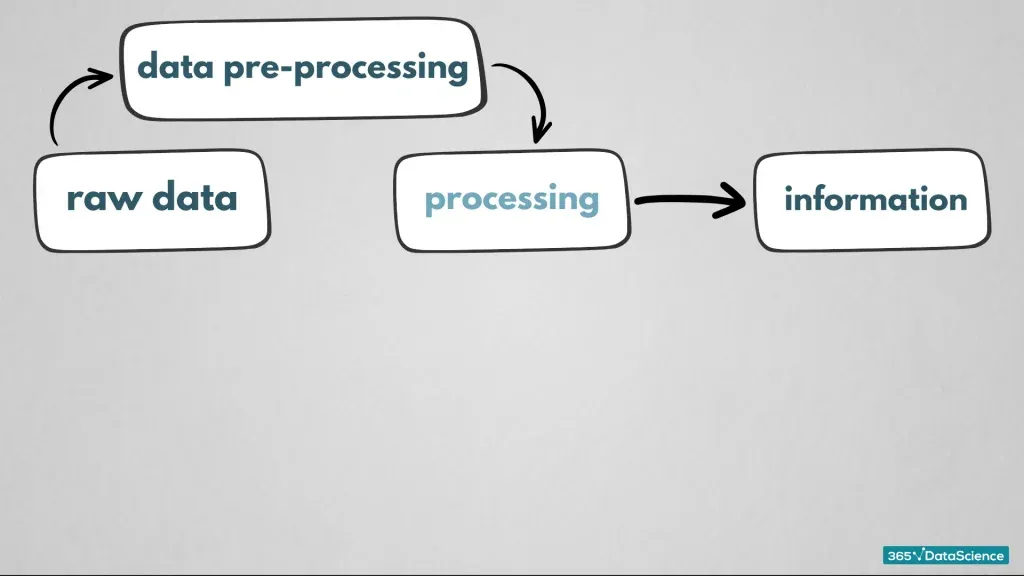
We gather raw data, then we process it to get meaningful information. Well, separating them was easy! Now, let’s get into the details!
What Is Raw Data?
Raw data (Also called ‘raw facts’ or ‘primary data’) is what you have accumulated and stored on a server but not touched. This means you cannot analyse it straight away. We refer to the gathering of raw data as ‘data collection’ and this is the first thing we do.
What Is Big Data? Big Data Vs. Traditional Data
We can look at data as being traditional or big data. If you are new to this idea, you could imagine traditional data in the form of tables containing categorical and numerical data. This data is structured and stored in databases which can be managed from one computer. A way to collect traditional data is to survey people. Ask them to rate how much they like a product or experience on a scale of 1 to 10.
Traditional data is data most people are accustomed to. For instance, ‘order management’ helps you keep track of sales, purchases, e-commerce, and work orders.
Big data, however, is a whole other story.
As you can guess by the name, ‘Big data’ is a term reserved for extremely large data.
You will also often see it characterised by the letter ‘V’. As in “the 3Vs of ‘big data”. Sometimes we can have 5, 7 or even 11 ‘V’s of big data. They may include – the Vision you have about big data, the Value big data carries, the Visualisation tools you use or the Variability in the consistency of big data. And so on...
However, the following are the most important criteria you must remember:
Volume
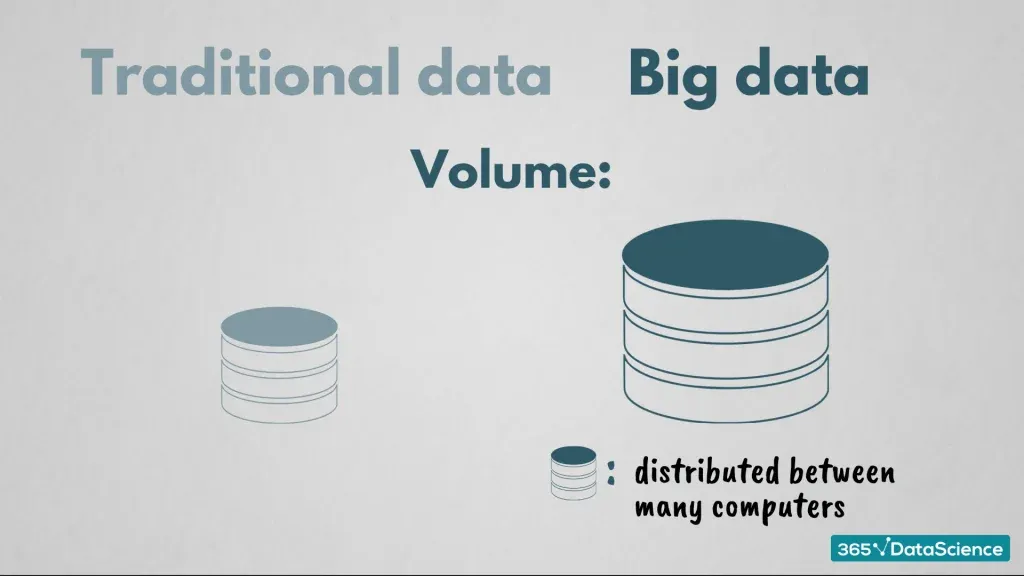
Big data needs a whopping amount of memory space, typically distributed between many computers. Its size is measured in terabytes, petabytes, and even exabytes.
Variety
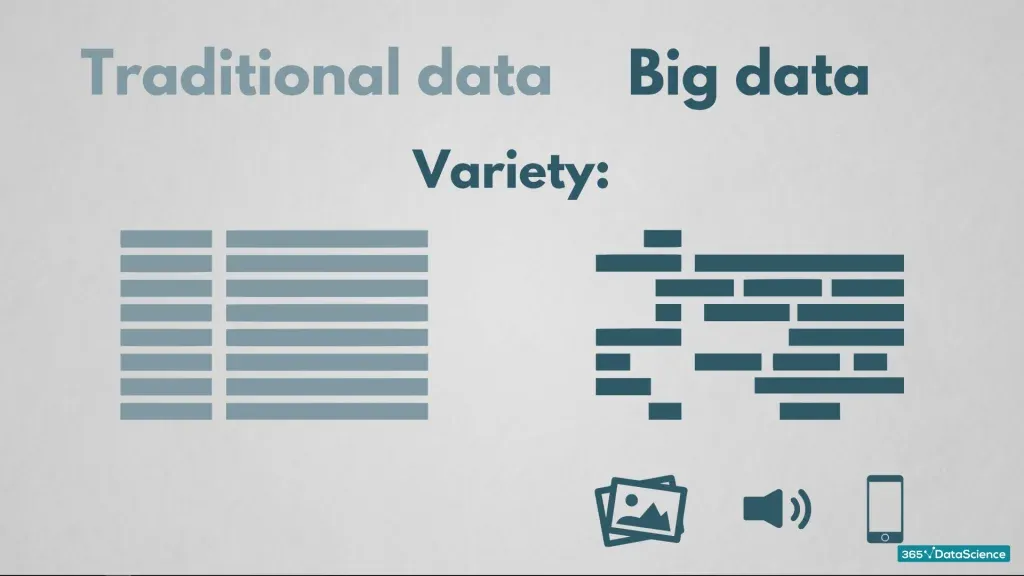 Here we are not talking only about numbers and text; big data often implies dealing with images, audio files, mobile data, and others.
Velocity
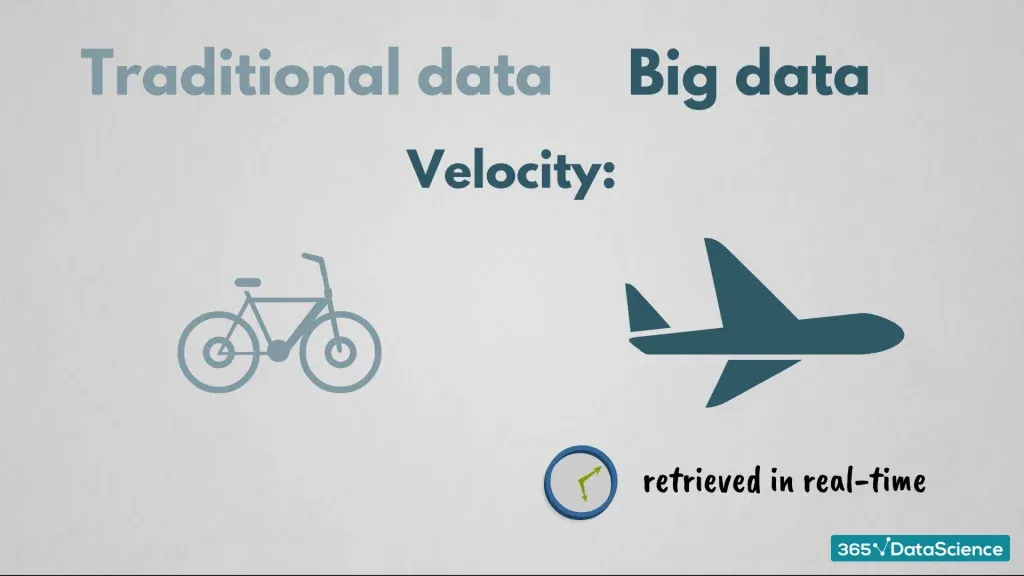
When working with big data, one’s goal is to make extracting patterns from it as quick as possible. Where do we encounter big data?
The answer is: in increasingly more industries and companies. Here are a few notable examples.
As one of the largest online communities, ‘Facebook’ keeps track of its users' names, personal data, photos, videos, recorded messages and so on. This means their data has a lot of variety. And with over 2 billion users worldwide, the volume of data stored on their servers is tremendous.
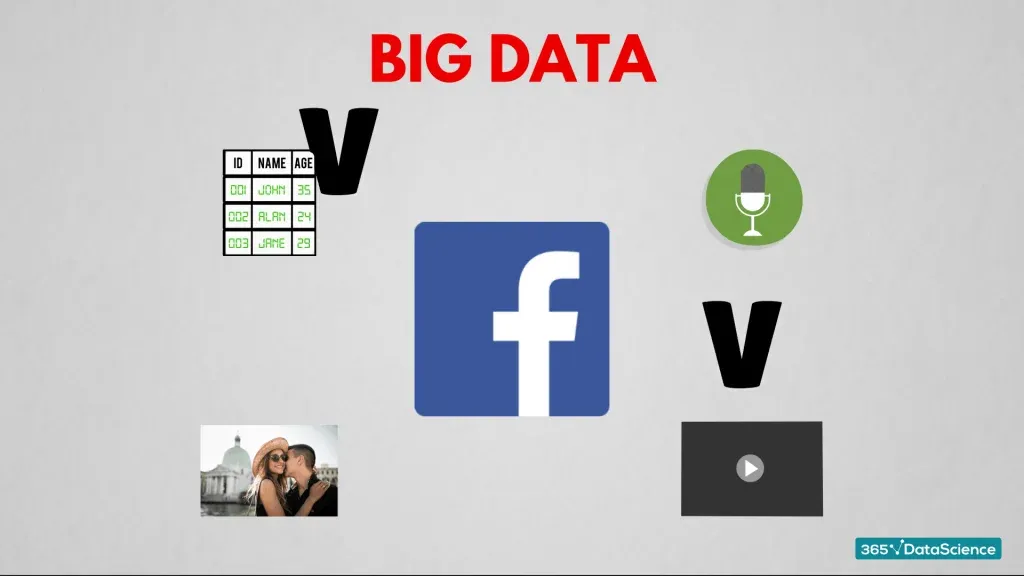
Let’s take ‘financial trading data’ for an extra example.
What happens when we record the stock price at every 5 seconds? Or every single second? We get a dataset that is voluminous, requiring significantly more memory, disc space and various techniques to extract meaningful information from it.
Both traditional and big data will give you a solid foundation to improve customer satisfaction. But this data will have problems, so before anything else, you must process it.
How to Process Raw Data?
Let’s turn that raw data into something beautiful!
The first thing to do, after gathering enough raw data, is what we call ‘data preprocessing’. This is a group of operations that will convert your raw data into a format that is more understandable and useful for further processing.
I suppose this step would squeeze in between raw data and processing! Maybe, we should add a section here…
Data Preprocessing: Labeling, Data Scrubbing, and Missing Values
So, what does ‘data preprocessing’ aim to do?
It attempts to fix the problems that can occur with data gathering.
For example, within some customer data you collected, you may have a person registered as 932 years old or ‘United Kingdom’ as their name. Before proceeding with any analysis, you need to mark this data as invalid or correct it. That’s what data pre-processing is all about!
Let’s delve into the techniques we apply while pre-processing both traditional and big raw data?
Class Labelling
This involves labelling the data point to the correct data type, in other words, arranging data by category.
We divide traditional data into 2 categories:
One category is ‘numerical’ - If you are storing the number of goods sold daily, then you are keeping track of numerical values. These are numbers which you can manipulate. For example, you can work out the average number of goods sold per day or month.
The other label is ‘categorical’ - Here you are dealing with information you cannot manipulate with mathematics. For example, a person’s profession. Remember that data points can still be numbers while not being numerical. Their date of birth is a number you can’t manipulate directly to give you any extra information.
Think of basic customer data. * (the dataset used is from our SQL course )
We will use this table, containing text information about customers, to give a clear example of the difference between a numerical and categorical variable. 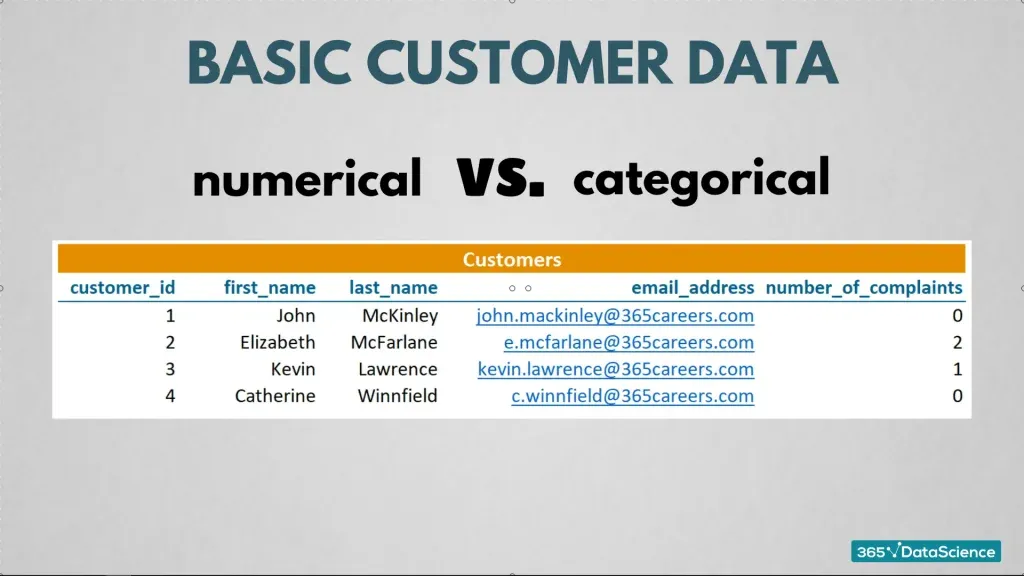
Notice the first column, it shows the ID assigned to the different customers. You cannot manipulate these numbers. An ‘average’ ID is not something that would give you any useful information. This means that even though they are numbers, they hold no numerical value and are categorical data.
Now, focus on the last column. This shows how many times a customer has filed a complaint. You can manipulate these numbers. Adding them all together to give a total number of complaints is useful information, therefore, they are numerical data. Another example we can look at is daily historical stock price data. * this is what we use in our course Python course.
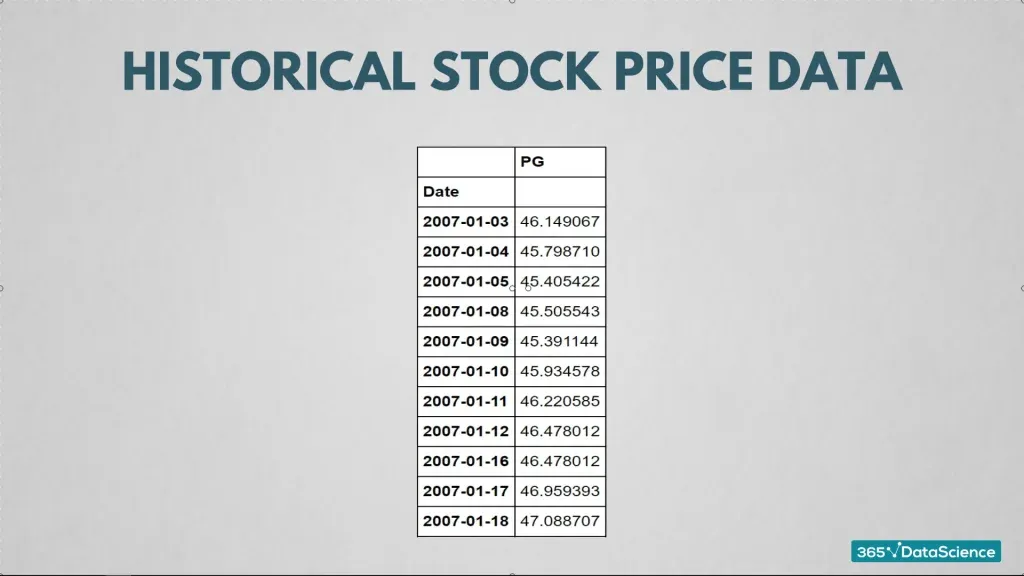
In the data set you see here, there’s a column containing the dates of the observations, which is considered categorical data. And a column containing the stock prices, which is numerical data.
When you work with big data things get a little more complex. You have much more variety, beyond ‘numerical’ and ‘categorical’ data, for example:
- Text data
- Digital image data
- Digital video data
- And digital audio data
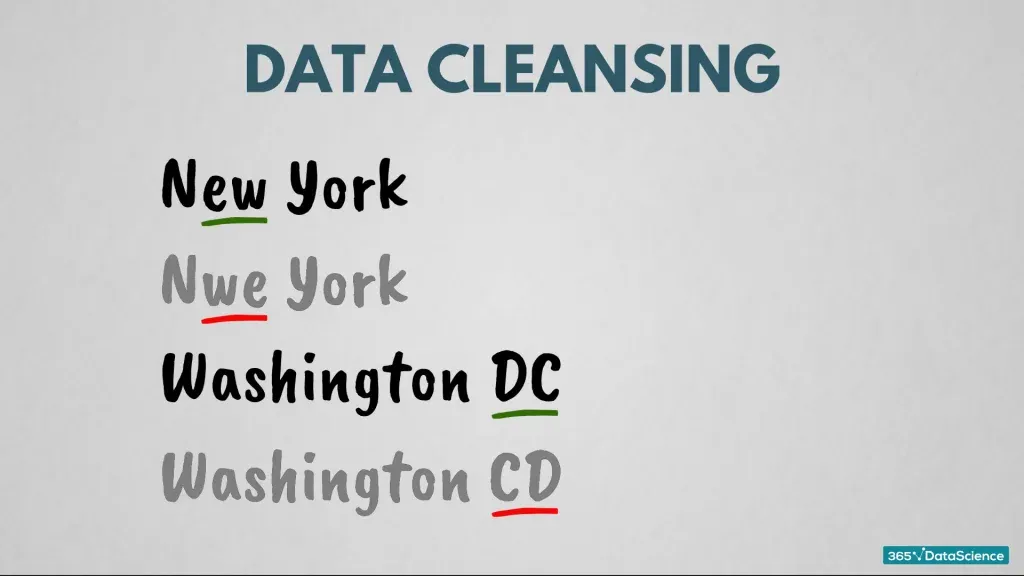
Data Cleansing
Also known as, ‘data cleaning’ or ‘data scrubbing’.
The goal of data cleansing is to deal with inconsistent data. This can come in various forms. Say, you gather a data set containing the US states and a quarter of the names are misspelled. In this situation, you must perform certain techniques to correct these mistakes. You must clean the data; the clue is in the name!
Big data has more data types and they come with a wider range of data cleansing methods. There are techniques that verify if a digital image is ready for processing. And specific approaches exist that ensure the audio quality of your file is adequate to proceed.
Missing Values
‘Missing values’ are something else you must deal with. Not every customer will give you all the data you are asking for. What can often happen is that a customer will give you his name and occupation but not his age. What can you do in that case? 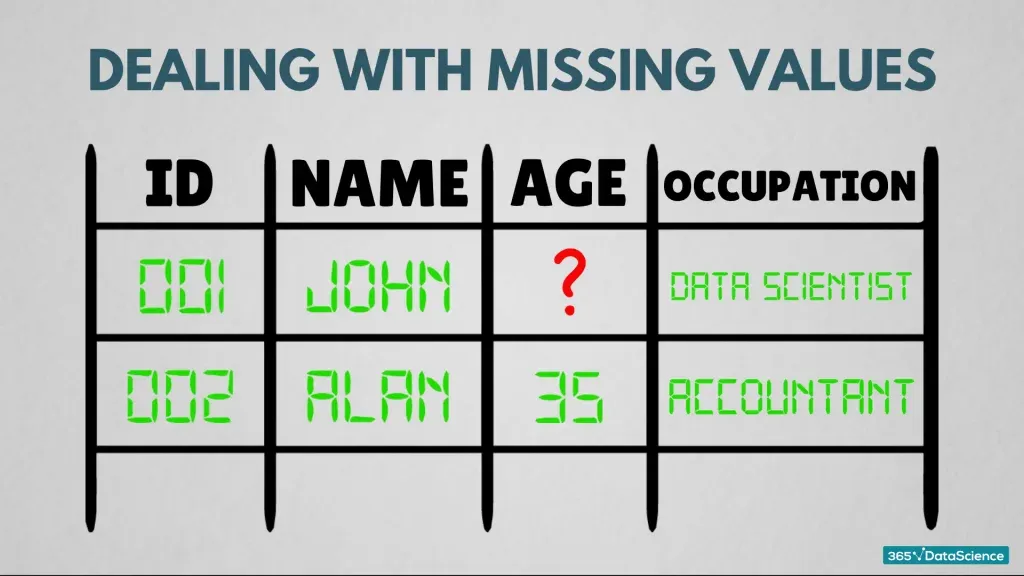
Should you disregard the customer’s entire record? Or could you enter the average age of the remaining customers?
Whatever the best solution is, it is essential you clean the data and deal with missing values before you can process the data further.
Traditional Data Processing Techniques: Balancing and Shuffling
Let’s move onto two common techniques for processing traditional data.
Balancing
Imagine you have compiled a survey to gather data on the shopping habits of men and women. Say, you want to ascertain who spends more money during the weekend. However, when you finish gathering your data you become aware that 80% of respondents were female and only 20% male.
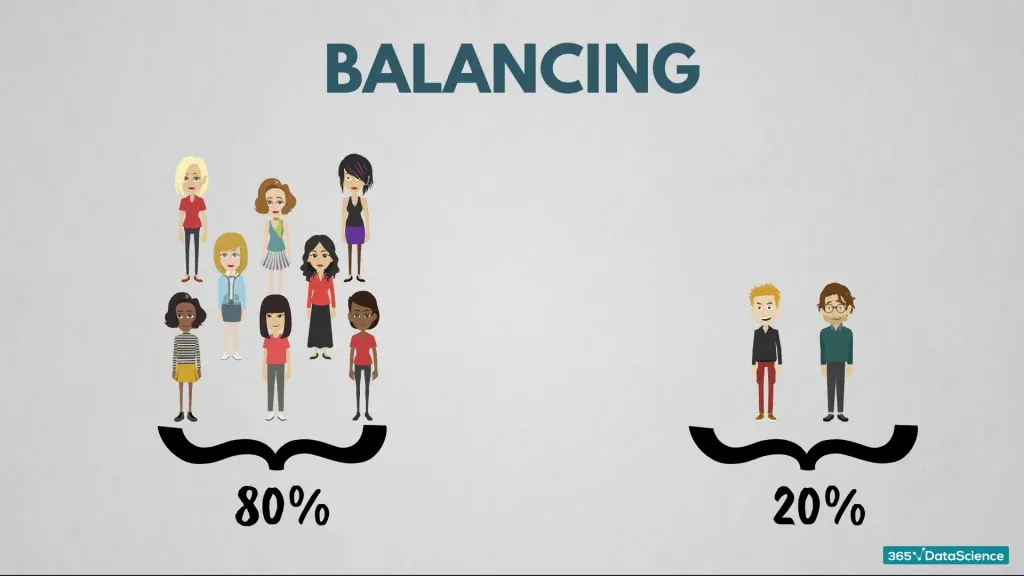
Under these circumstances, the trends you discover will be more towards women. The best way to counteract this problem is to apply balancing techniques. Such as taking an equal number of respondents from each group, so the ratio is 50/50. 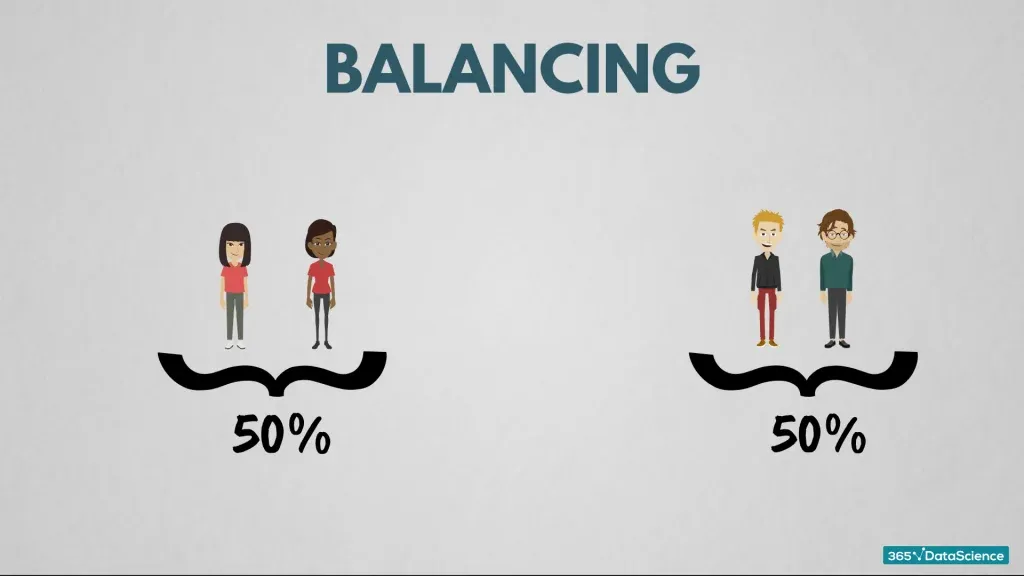
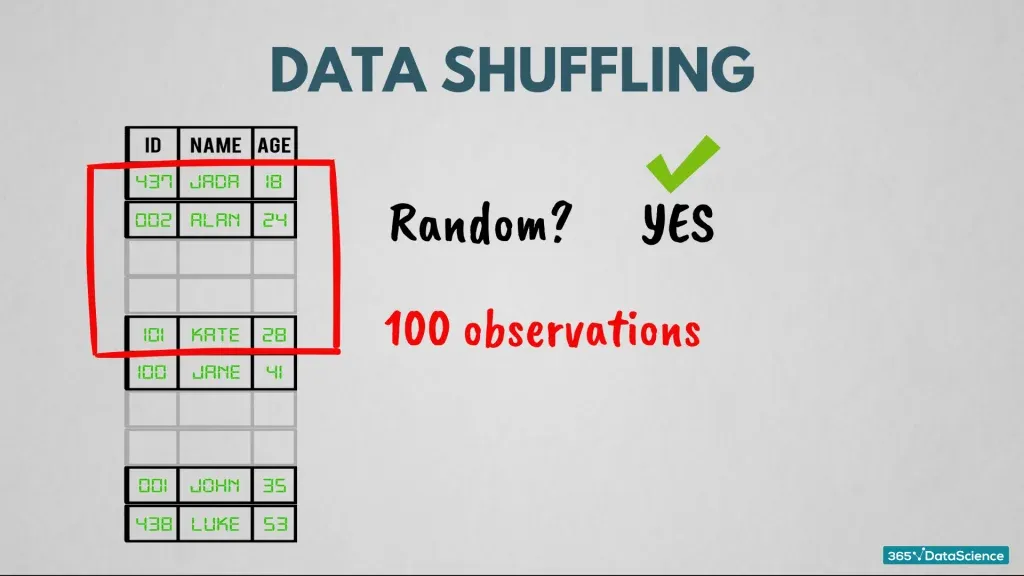
Data Shuffling
Shuffling the observations from your data set is just like shuffling a deck of cards. It will ensure that your dataset is free from unwanted patterns caused by problematic data collection. Data shuffling is a technique which improves predictive performance and helps avoid misleading results.
But how does it avoid delusive results?
Well, it is a detailed process but in a nutshell, shuffling is a way to randomise data. If I take the first 100 observations from the dataset that’s not a random sample. The top observations would be extracted first. If I shuffle the data, I am sure that when I take 100 consecutive entries, they’ll be random (and most likely representative).
Big Data Processing Techniques: Data Mining and Masking
Let’s look at some case-specific techniques for dealing with big data.
Text Data Mining
Think of the huge amount of text that is stored in digital format. Well, there are many scientific projects in progress which aim to extract specific text information from digital sources. For instance, you may have a database which has stored information from academic papers about ‘marketing expenditure’, the main topic of your research. You could find the information you need without much of a problem if the number of sources and the volume of text stored in your database was low enough. Often, though the data is huge. It may contain information from academic papers, blog articles, online platforms, private excel files and more.
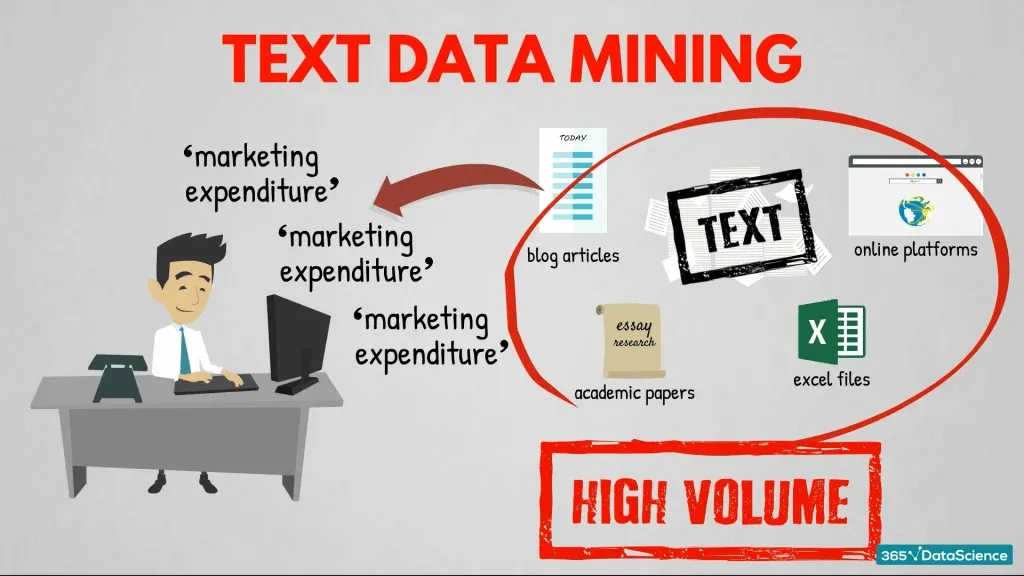
This means you will need to extract ‘marketing expenditure’ information from many sources. In other words, ‘big data’. Not an easy task, which has led to academics and practitioners developing methods to perform ‘text data mining’.
Data Masking
If you want to maintain a credible business or governmental activity, you must preserve confidential information. When personal details are shared online, you must apply some ‘data masking’ techniques to the information so you can analyse it without compromising the participant's privacy.
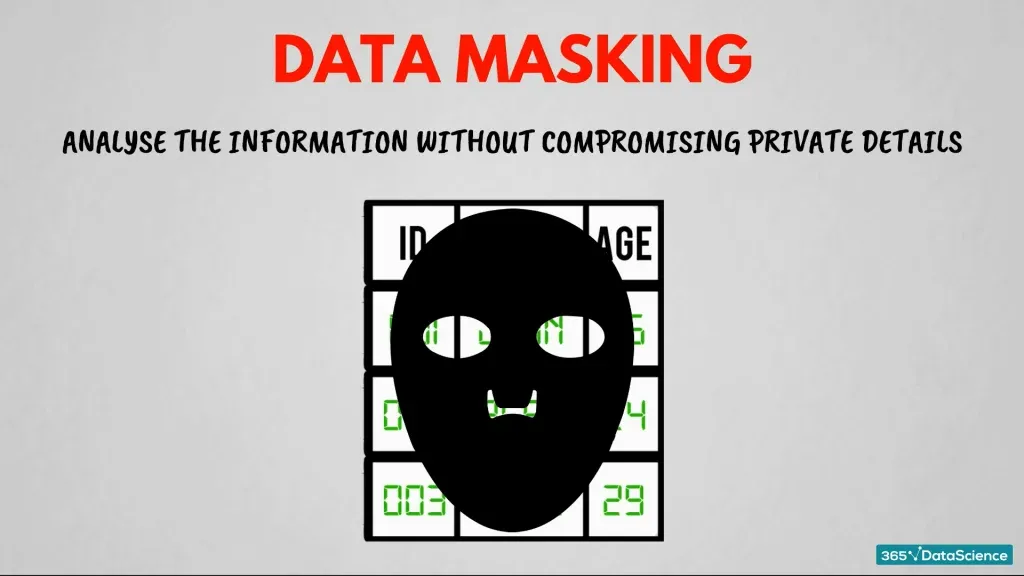
Like data shuffling, ’data masking’ can be complex. It conceals the original data with random and false data and allows you to conduct analysis and keep all confidential information in a secure place. An example of applying data masking to big data is through ‘confidentiality preserving data mining’ techniques.
Once you finish with data processing, you obtain the valuable and meaningful information you need.
I hope we’ve given a little insight into the differences between traditional and big data and how we process them.
For more detailed information about everything data science, check out our 'Defining Data Science: The What, Where and How of Data Science' article!
Ready to Take the Next Step Towards a Data Science Career?
Check out our Data Cleaning and Preprocessing with pandas Course. Learn how to clean data from all types of sources and preprocess it for actual visualizations and analysis by implementing the right statistical tools and advanced pandas techniques.