Don’t underestimate the importance of a good data science project in your portfolio—it can be a defining factor in your career progression. While learning is the first step on the ladder to career success, you must also demonstrate your abilities and intuitive mindset by working on real-life projects.
The great aim of education is not knowledge but action.
Herbert Spencer
At 365 Data Science, we’re committed to helping you advance on your journey. Whether starting from scratch or looking to upskill, you’ll be supported every step of the way—and that extends beyond us providing high-quality learning material. We know you also need to exercise what you’ve studied and put it into practice.
That is why we’re excited to present the 365 Learning Data Challenge!
You’ll get to work with real-world data, develop your analytical skills, and create a project that can serve as a fantastic addition to your professional portfolio.
Oh, and not to mention the chance to win amazing prizes!
Does this sound intriguing? Read on to find out more.
Table of Contents
- What Is the 365 Learning Data Challenge?
- How to Participate?
- What Can You Win?
- Project Description
- Project Structure
- FAQ
- Join the 365 Learning Data Challenge!
What Is the 365 Learning Data Challenge?
For this challenge, you’ll take on the role of a data scientist at 365. Your task is to analyze data on student engagement, gather insights, and identify key opportunities for improvement.

This project can be completed in one of two parts (or both, depending on your preferences):
- Design a dashboard
- Build a machine learning model
Both options are valid for participation. You can submit either a dashboard or an ML model as an eligible entry or complete both to increase your chances of winning.
We’ll outline each part in its corresponding sections of this article.
Additionally, you can take this challenge in two ways—unguided or guided. The former provides only the bare bones of the task, while the latter gives you a specific direction to follow, providing ideas on the analyses and types of visualizations that can be included. The guided approach is available only inside the 365 platform—access it by registering with a Free Plan account. No credit card is required.
Feel free to use any technology you are most comfortable with or challenge yourself by learning a new skill.
How to Participate?
Once you’re ready with your project(s), share your work with us as a LinkedIn post(s).
- Add a screenshot of your work to your LinkedIn post (required for dashboard, optional for ML).
- Share your motivation for taking on the challenge.
- Describe your method and findings (preferably as bullet points).
- Include relevant metrics that evaluate the model’s performance (ML only).
- Tag us @365 Data Science and use the hashtag #365learningdatachallenge.
- Include a public link to your interactive dashboard (optional).
- Attach a link to a GitHub repository where you’ve stored relevant code (required for ML, optional for dashboard).
To be eligible for the challenge, you need to share your project(s) via your LinkedIn profile no later than December 2, 2022, at 11:59 PM EST.
What Can You Win?
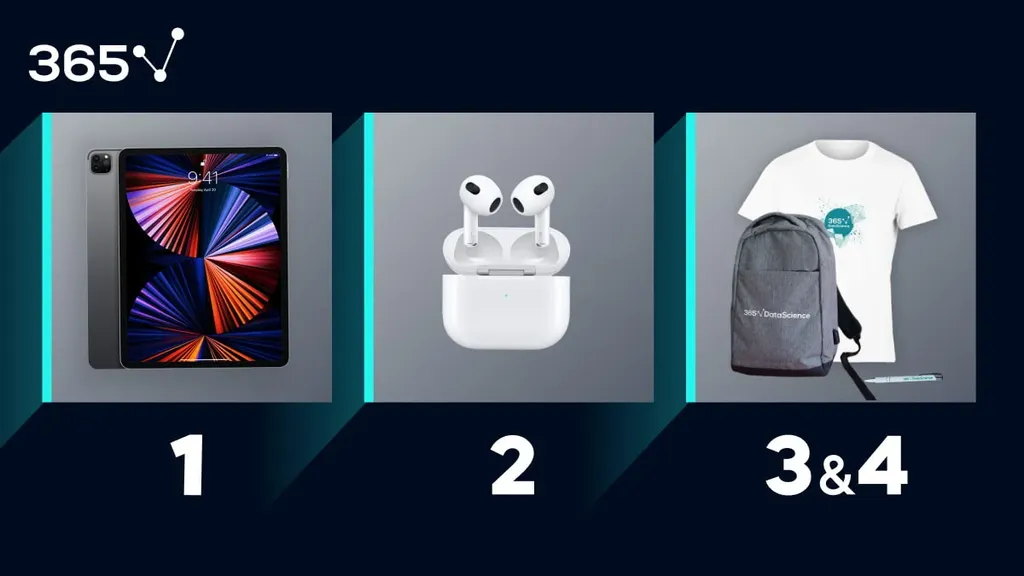
The best part about a challenge—aside from the winners’ bragging rights, of course—is the prizes. And we’ve got some truly incredible ones in store for you. By entering the 365 Learning Data Challenge, you’re in the running to win one of the following:
- 1st place: Apple iPad Pro 512GB Wi-Fi
- 2nd place: Apple Air Pods 3rd generation
- 3rd and 4th place: Stylish 365 gear
Both guided and unguided projects enter the competition on equal footing and are eligible to win. Whether you proceed with one or the other depends entirely on your preferences.
The winning entries will be determined based on the number of reactions their posts receive on LinkedIn. Multiple submissions are allowed to account for the two parts of the project, in which case your score would be based on the summed number of reactions across your challenge-related posts.
Project Description
365 Data Science is an online learning platform specializing in data science courses. Students learn by watching video content, then evaluate their knowledge by taking quizzes, practice exams, course exams, and career track exams. The exams can be attempted more than once.
As a data scientist at 365, your task is to analyze an extract of a database on student engagement and identify key areas of improvement. The period under analysis is January 1, 2022 – October 20, 2022.
Keeping in mind the metrics that 365’s CEO might find useful, build a single-page dashboard or machine learning model and discuss your findings.
Resources
As part of the challenge, you will have access to the project database and a series of helpful resources to use as you work.
- You can download and work with the data in one of two ways: a MySQL database of 11 tables or a collection of 11 .csv files.
- You are not obligated to use all tables included in the database—only those you find relevant for your analysis.
Download the resources files here.
And in case you need a knowledge boost, here are some of the courses the 365 team recommends to help you with this challenge:
- SQL
- Data Cleaning and Pre-processing with pandas
- The Complete Data Visualization Course with Python, R, Tableau, and Excel
- Power BI
- SQL + Tableau
- Machine Learning in Python
Project Structure
The 365 Learning Data Challenge is made up of two parts—dashboard design and building a machine learning model.
Both include additional tasks you need to complete to produce effective results.
You can approach this project in one of two ways:
- Unguided: You only need to read the brief description of each task and analyze the metrics you find most relevant for depicting students’ engagement.
- Guided: You can use optional descriptions with detailed instructions regarding each task. Please note that this option offers ideas, not solutions. There is no right or wrong way to complete the challenge.
In this article, you will find only task descriptions for the unguided project approach. If you’d like to complete the challenge using the guided instructions, sign up to the 365 platform with a Free Plan to be granted access.
1. Dashboard Design
Dashboard Structure
The main objective is to build a single-page dashboard with key metrics, insights, and visualizations on student engagement.
Start with defining the questions you would like to give answers to. Determine what visualization best fits a given query and how the information could be filtered. Then, create a rough sketch of the dashboard.
Data Preparation
Your dashboard needs clean data to present precise results. You must carefully prepare the data to feed it into your favorite visualization program and create the plots.
You can use MySQL to retrieve and join information from multiple tables, creating a sophisticated analysis. You are also welcome to perform this pre-processing step in Python or any other programming language you feel most comfortable with. You can also manipulate the relevant data directly in Tableau, Power BI, or another visualization tool.
Dashboard Construction
This is where you reveal your most creative side!
Create each visualization separately, then build your single-page dashboard chart by chart. Make sure it is visually attractive, intuitive, and practical.
Results Discussion
After completing your dashboard, you should present your findings. Discuss the plots you’ve built, the information they convey, and the conclusions we can draw from them.
This part is essential as it is the underlying reason for creating a dashboard of this sort. Given specific results and certain information from the dashboard, the 365 team can determine what actions can be taken to improve the company’s growth and deliver its students the best learning experience.
2. Building a Machine Learning Model
The second task has you develop a machine learning model to predict whether a Free Plan user would convert to a paid subscriber or not.
Think of the features that could help determine the outcome. Share your result by supporting them with relevant metrics, a confusion matrix, or another industry-standard method for model evaluation.
Note that this classification problem deals with a heavily imbalanced dataset.
FAQ
Join the 365 Learning Data Challenge!
Learning is a stepping stone toward achieving your goals, but true success comes with putting all you know into practice. Employers appreciate candidates who can demonstrate initiative and prove their abilities to handle real-world projects. That’s why the 365 Learning Data Challenge can be the ideal portfolio booster.
Share your dashboard with the community, uncover valuable insights, and gain meaningful experience. Remember, you have until December 2, 2022, at 11:59 PM EST.
We’re very excited to see your entries.
Good luck!
