In this article, you will discover the differences between point estimates and confidence intervals. If you have little statistical experience, you will tend to observations based on point estimates (without even knowing it). On the other hand, if you are experienced, or simply want to get better at statistics, you’ll prefer the bigger picture. That’s when you’ll realize that confidence intervals actually have an edge over point estimates.
So what’s this point estimate vs confidence interval estimate distinction about?
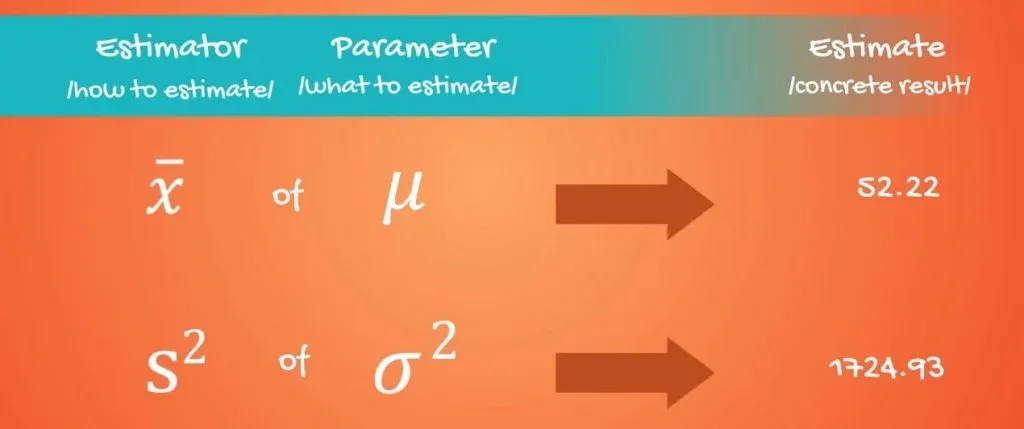
First, let’s introduce the concept of an estimator. An estimator of a population parameter an approximation depending solely on sample information.
A specific value is called an estimate.
The Two Types of Estimates: Point Estimate and Confidence Interval Estimate
There are two types of estimates – point estimates and confidence interval estimates.
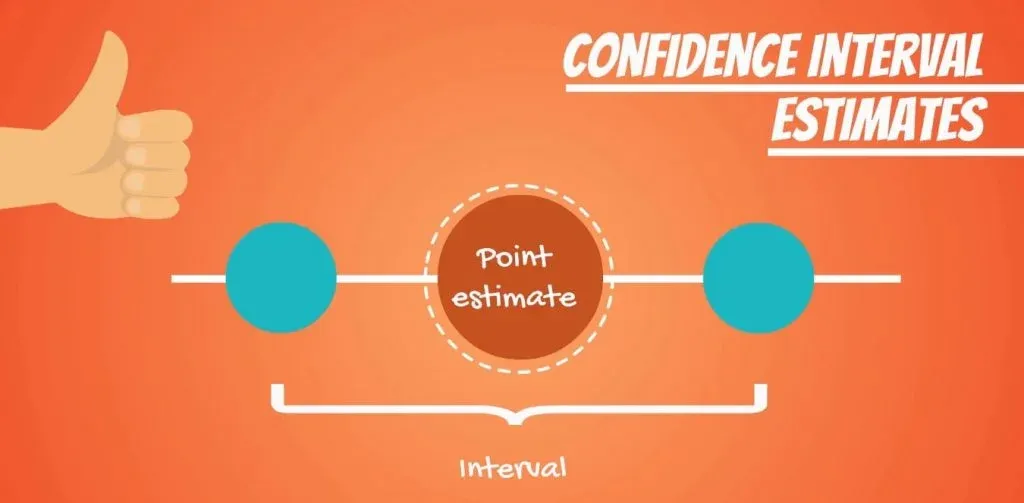
A point estimate is a single number. Whereas, a confidence interval, naturally, is an interval.
The two are closely related. In fact, the point estimate is located exactly in the middle of the confidence interval. However, confidence intervals provide much more information and are preferred when making inferences.
There are a few estimates which you may have seen already.
The sample mean, x bar, is a point estimate of the population mean mu! Moreover, the sample variance S2 is an estimate of the population variance: sigma2.
The Two Properties of Different Estimators: Bias and Efficiency
There may be many estimators for the same variable. However, they all have two properties: bias and efficiency.
We will not prove them as the mathematics associated is out of the scope of our tutorials. However, you should have an idea about the concepts.
Estimators are like judges - we are always looking for the most efficient unbiased estimators.
Biased and Unbiased Estimators
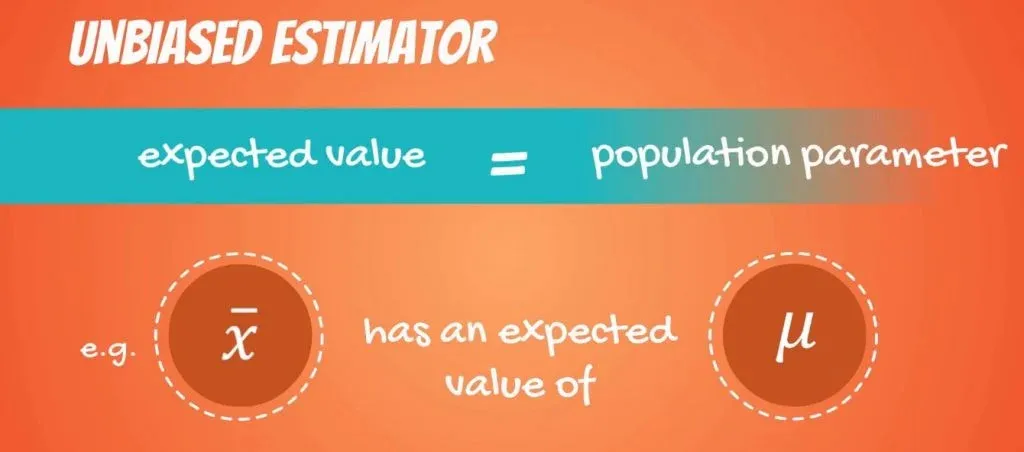
An unbiased estimator has an expected value equal to the population parameter.
Providing an Example
Let’s think of a biased estimator to explain that point. What if somebody told you that you will find the average height of Americans by:
- Taking a sample
- Finding its mean
- And then adding 1 foot to that result.
So, the formula is x bar + 1 foot.
Well, I hope you won’t trust them. They gave you an estimator, but a biased one. It makes much more sense that the average height of Americans is approximated just by the sample mean. We say that the bias of this estimator is 1 foot.
Efficient Estimators
Let’s move onto efficiency!
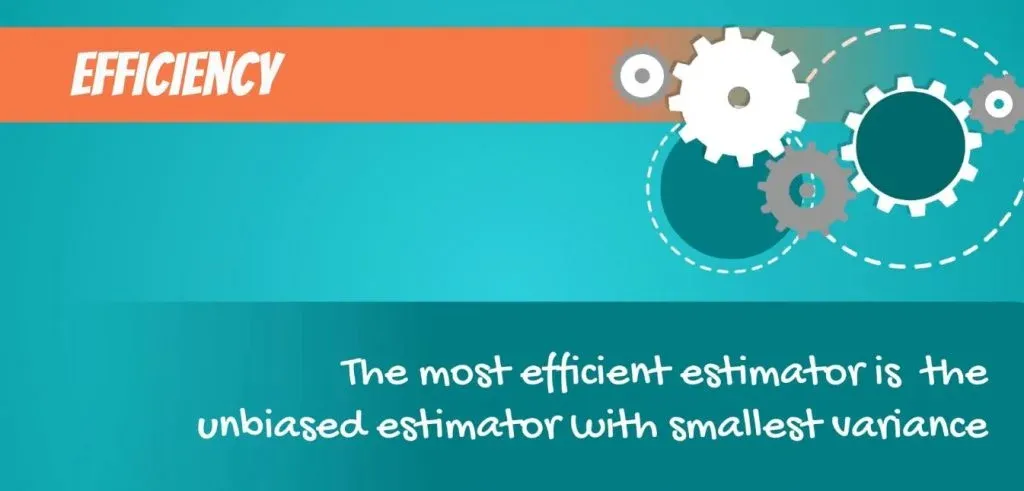
The most efficient estimators are the ones with the least variability of outcomes. It is enough to know that most efficient means: the unbiased estimator with the smallest variance.
What's the Difference Between Estimators and Statistics?
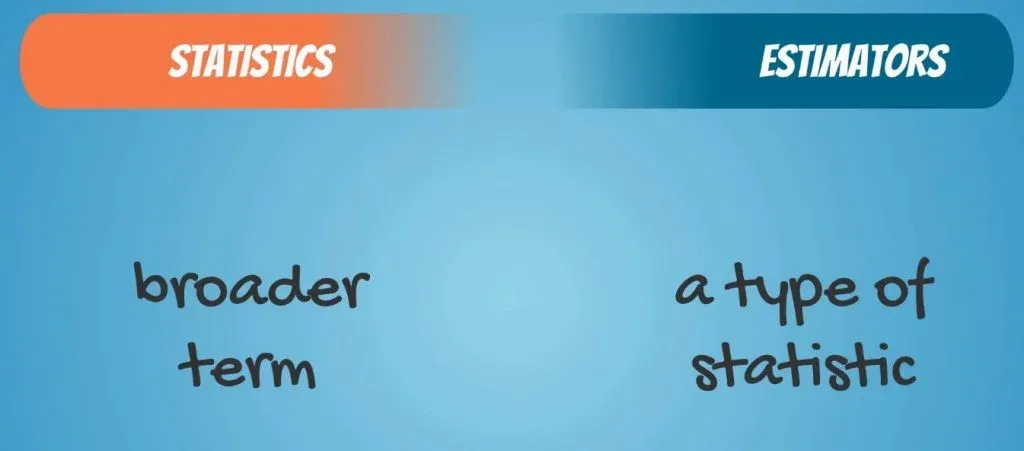
A final note worth making is about the difference between estimators and statistics. The word ‘statistic’ is the broader term. A point estimate is a statistic.
Author's note: Fancy statistics? You can learn more in our tutorials Exploring the OLS Assumptions, Measuring Explanatory Power with the R-squared, Central Limit Theorem, and Measures of Variability.
What's the Disadvantage of the Point Estimator?
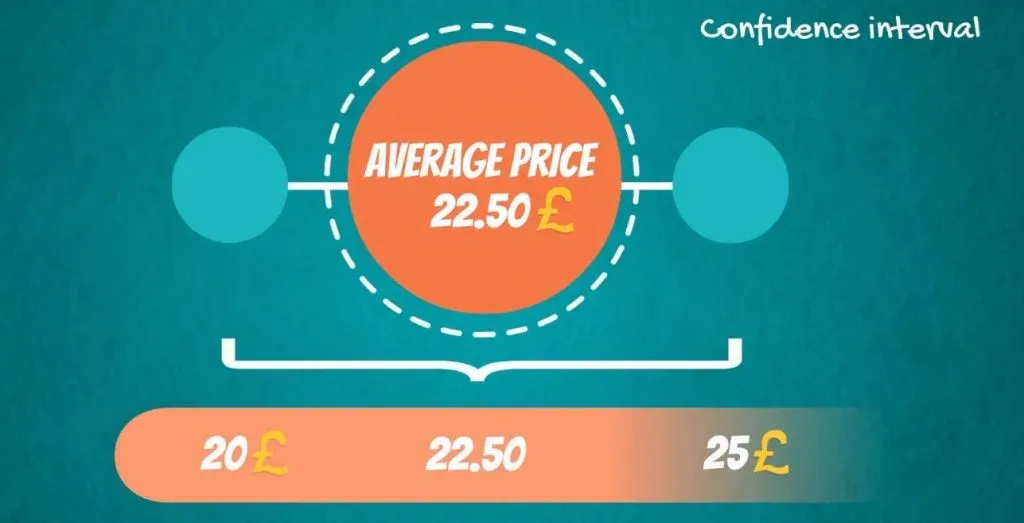
Point estimators are not very reliable, as you can guess. Imagine visiting 5% of the restaurants in London and saying that the average meal is worth 22.50 pounds.
You may be close, but chances are that the true value isn’t really 22.50 but somewhere around it. When you think about it, it’s much safer to say that the average meal in London is somewhere between 20 and 25 pounds. In this way, you have created a confidence interval around your point estimate of 22.50!
What's the Advantage of the Confidence Interval?
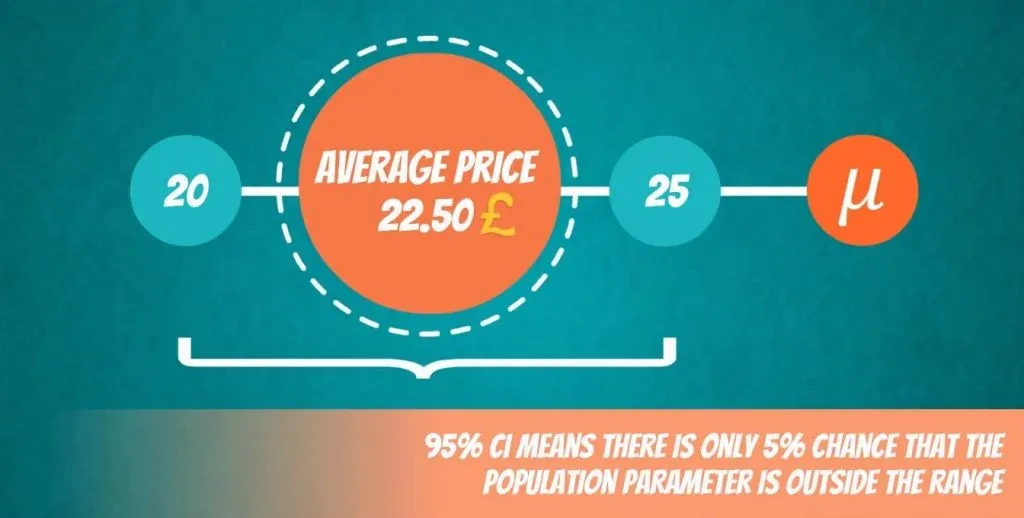
A confidence interval is a much more accurate representation of reality. However, there is still some uncertainty left which we measure in levels of confidence. So, getting back to our example, you may say that you are 95% confident that the population parameter lies between 20 and 25 quid.
Side note: Keep in mind that you can never be 100% confident unless you go through the entire population!
And there is, of course, a 5% chance that the actual population parameter is outside of the 20 to 25 pounds range.
We’ll see that if the sample we have considered deviates significantly from the entire population.
The Level of Confidence
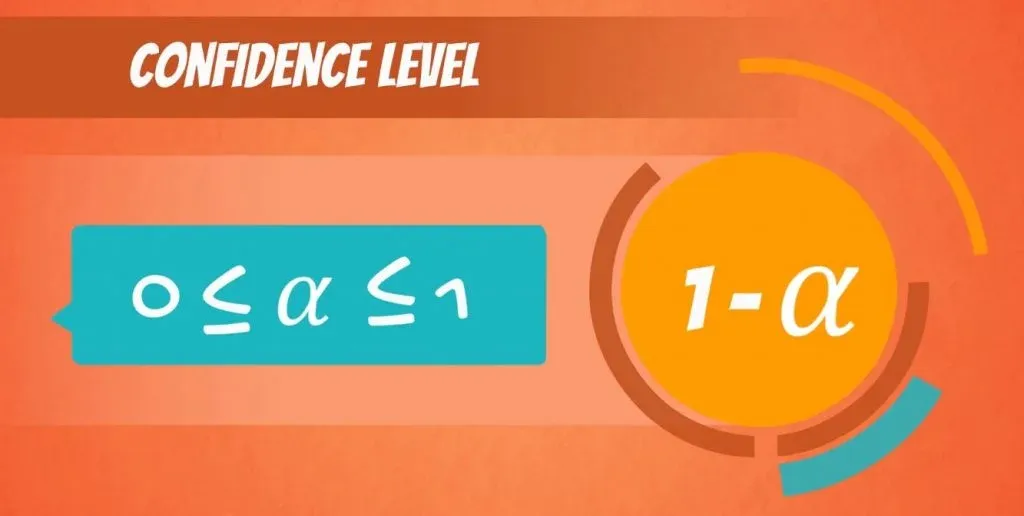
There is one more ingredient needed: the level of confidence. It is denoted by: 1 - alpha, and is called the confidence level of the interval.
Alpha is a value between 0 and 1.
For example, if we want to be 95% confident that the parameter is inside the interval, alpha is 5%.
If we want a higher confidence level of, say, 99%, alpha will be 1%.
Point Estimate and Confidence Interval Formula
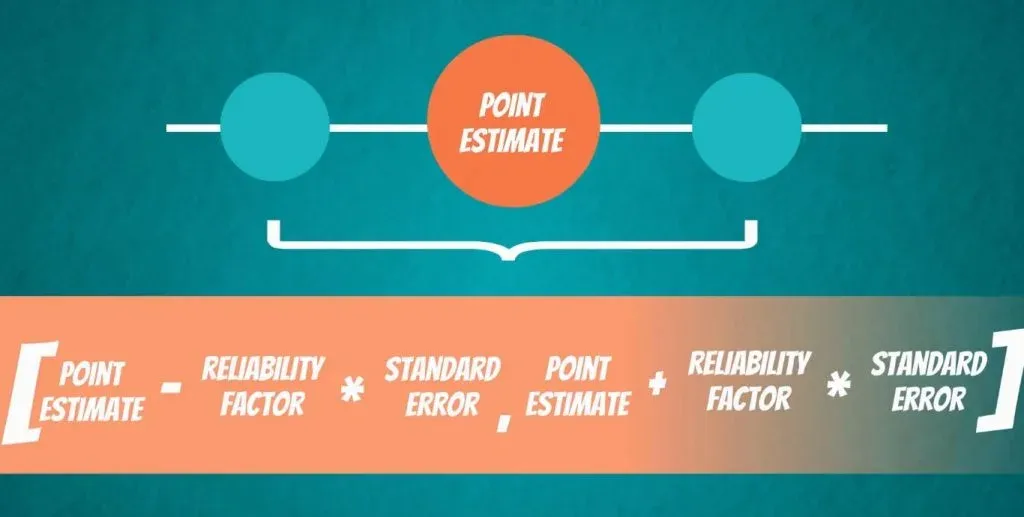
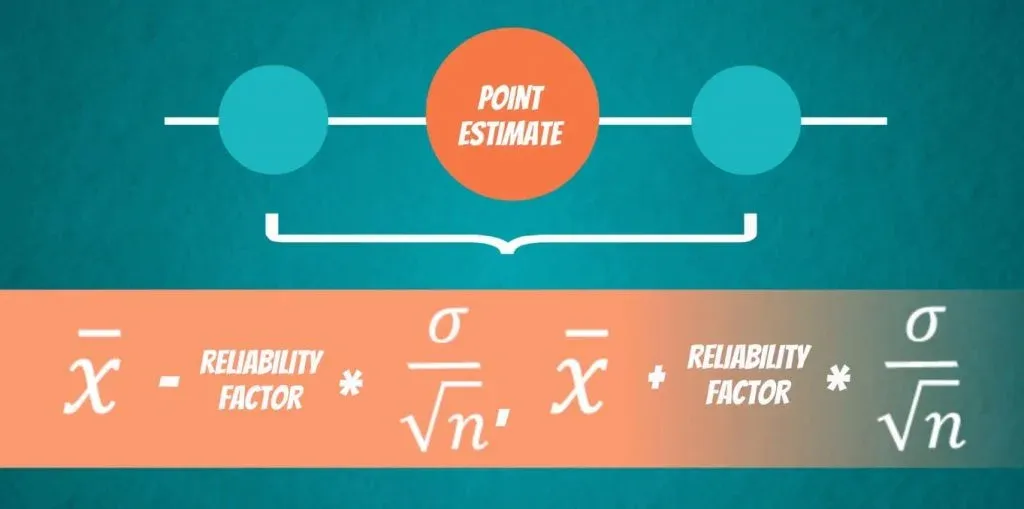
The formula for all confidence intervals is: FROM the point estimate - the reliability factor * the standard error TO the point estimate + the reliability factor * the standard error.
We know what the point estimate is – values like x bar and s bar. We have also covered what the standard error is.
The Relationship Between Confidence Interval and Point Estimate
Now, we will go over the point estimates and confidence intervals one last time.
Imagine that you are given a dataset with a sample mean of 10. In this case, is 10 a point estimate or an estimator? Of course, it is a point estimate. It is a single number given by an estimator. Here, the estimator is a point estimator and it is the formula for the mean.
Now, about the relation between a confidence interval and a point estimate. The point estimate is simply the midpoint of the confidence interval.
For more on mean, median and mode, read our tutorial Introduction to the Measures of Central Tendency.
Point Estimate vs Confidence Interval
In conclusion, there is one main factor which you should keep in mind when deciding which one to use. And that is, whether or not you want to be as accurate as possible. A confidence interval will provide valid result most of the time. Whereas, a point estimate will almost always be off the mark but is simpler to understand and present.
Now, if you want to obtain accurate measures but you are tired of all the numbers and calculations, we have just the right tool for you. Check out our confidence interval calculator to compute the metric and learn about it.
***
Interested in learning more? You can take your skills from good to great with our statistics course!
Try statistics course for free
Next Tutorial: What is the Student's T Distribution?


