What Is Data Wrangling?
Data wrangling, also known as data munging, is a multi-step process that involves transforming “raw” data we have just obtained into another format, with the goal of making it easier to understand and hence analyse. The transformations we are referring to are applied to the rows, columns, specific values, or an entire dataset and include:
- Parsing – Extracting relevant information from “raw” data
- Merging/Joining – Merging datasets that have common parameters
- Cleaning – Removing impossible and irrelevant values
- Expanding – Using the data available to us to generate more data
- Consolidation – Gather all clean data into a single dataset
- Storing – Save the data in the desired format (e.g. csv/JSON/XML)
The process of data munging is of crucial importance because it allows us to understand and make use of enormous amounts of unprocessed data. To give a better answer to the question “What is Data Wrangling”, we’ll consider an example about cars and their specifications. First, though, we should decide on the right tools for our analysis.
Data Wrangling Tools
Python
Python has powerful libraries such as pandas and NumPy that have in-built functions that allow us to perform all steps of data munging with ease. Parsing, merging, cleaning and expanding of large datasets can be carried out in a single line of code. Combining this with Python’s beginner-friendly syntax (easy to read) and availability of good Machine Learning and Deep Learning libraries (e.g. scikit-learn and TensorFlow) have made it a very popular choice for data wrangling and data science.
R
R, just like Python, has powerful libraries such as tidyr and dplyr that help us greatly with munging data in very few lines of code. The ability to effectively perform data wrangling, along with the availability of many statistical models, have made R a very popular choice for data munging, as well as data science.
For this tutorial and our example concerning cars, we’ve chosen Python. However, for you R fans, we’ve dedicated a portion of our Data Wrangling Cheat Sheet to useful data wrangling libraries and functions in the R programming language.
Data Wrangling with Python
Parsing
Suppose that we have extracted our data in some format, in this case, JSON. Now, we want to fit it into a data structure such as a pandas (Python library) data frame using some algorithm. For example, if we have the name and model of a car and its fuel efficiency measured in miles per gallon or mpg for short, we want each parameter to go in a separate column. We want something that looks like this:
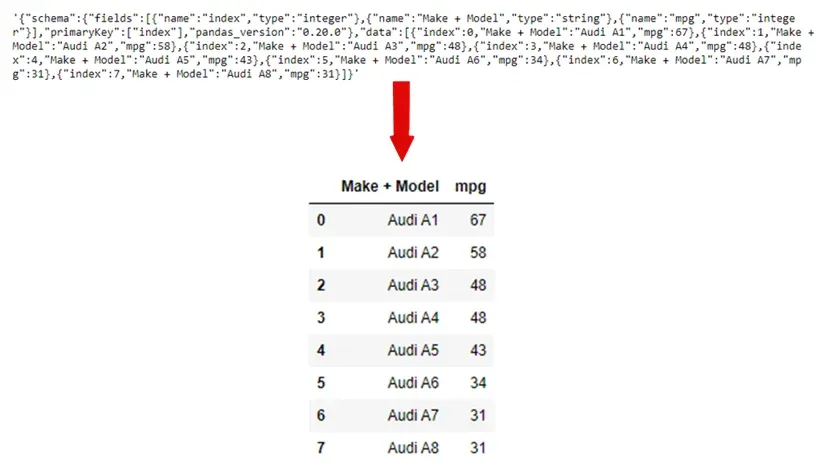
This is a lot easier to interpret than the “raw” format, so it makes you understand your data better, which makes it easier to establish the goals of your study.
Merging/Joining
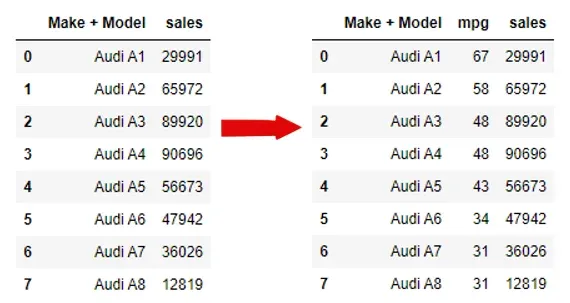
Now, let’s consider that we have obtained the information of the sales of each model. We want to create another data frame. However, the data structures above and below are separate, which makes it harder to work with. Thus, we merge the two tables as we observe below.
Cleaning
When we get our data, it is usually not “clean” meaning that it contains information that is impossible to occur (e.g. mpg = -15), entries are not in a format that we can use (e.g. NaN in Python), and that we don’t need for our analysis (e.g. car color when measuring fuel efficiency). Having data that hasn’t been cleaned properly can lead to skewed and misleading results, which in the real world could be costly for companies.
Let’s continue with our example and suppose that we want to measure if fuel efficiency is related to sales. By examining our table below, we can see that there is some information that is clearly wrong like a negative mpg, and some that is irrelevant: most popular color. Our aim is to remove them in order to make our table more readable. This is the result:
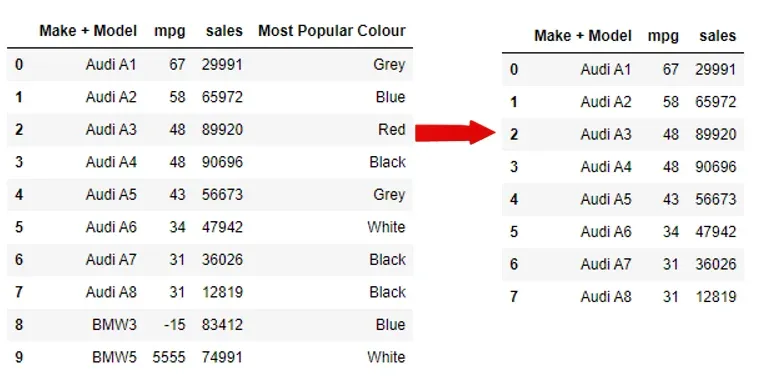
Now our data frame is a lot easier to read, as we removed the irrelevant color column. More importantly, we extracted the inaccurate mpg entries in our table. There are many ways to deal with missing/incorrect values in a data frame, but for an introduction into data wrangling, removing them would be sufficient.
Expanding
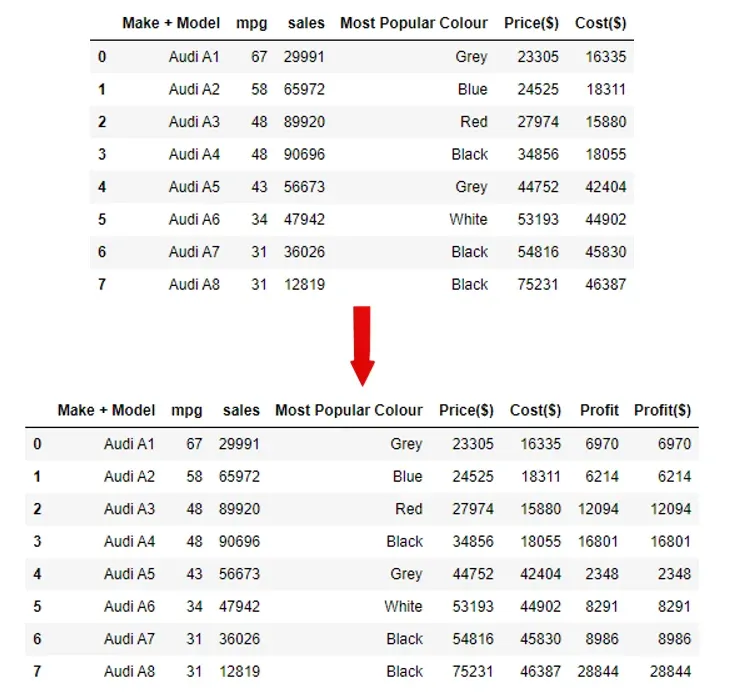
Let’s examine the data frame below. As we can see, two of the columns are about the cost of producing and the price of each car. We can use this information to create a new column with the profit.
Data Wrangling vs ETL
Extract, Transform, Load (ETL) follows a similar process to data wrangling. Data is extracted from a source, the transformations, which include merging, cleaning, and expanding are applied, and then finally the data is loaded into a database (e.g. MySQL), from where it can be accessed when needed. However, ETL is designed to work with data that already has some sort of structure, which means that the parsing step doesn’t play a big role in the process. But, the need for extracting relevant data from huge datasets is becoming more and more important with the rise of big data and complex “raw” sources, and this is where data wrangling tools such as Python and R excel.
Data Wrangling Cheat Sheet with Python and R
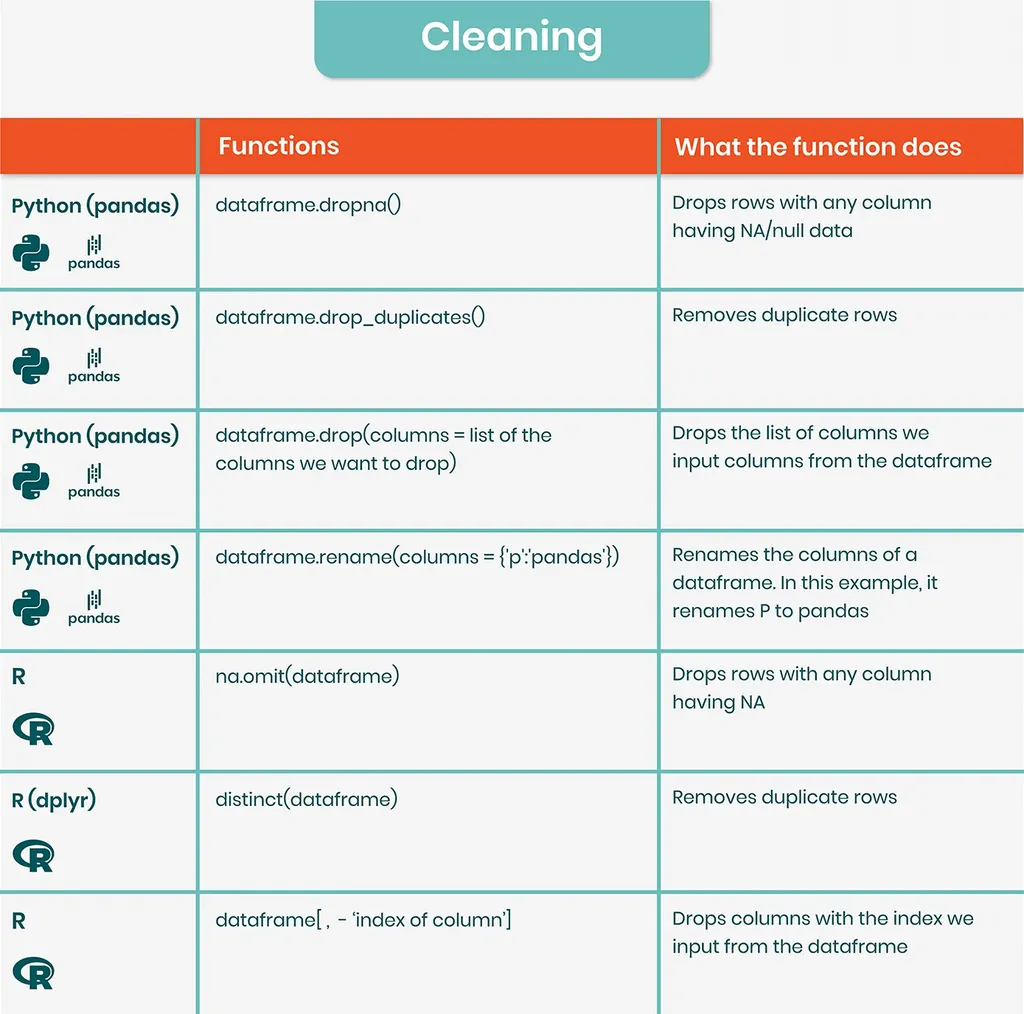
There are numerous functions, dedicated to cleaning or merging data. Keeping track of all of them can be difficult even for experienced data analysts. That’s why we’ve created our very own cheat sheet, including functions and libraries, which in our experience allow us to perform data wrangling effectively:
Data Wrangling with Python: Next Steps
After this short introduction into the world of data wrangling, you’re surely noticing something: this is a massive and wide field! We, at 365, see it as something of an advantage, as it presents many people with the opportunity to find a career in data analytics or data preprocessing. If that’s something you’re interested in and you’d like to build your data wrangling skills, you can try our Data Preprocessing with Numpy Course, for free.

