Businesses accumulate vast amounts of data on a regular basis. But it wasn't until recent years that they realized what a gold mine they’re sitting on. That’s because they haven’t had the right people to make sense of the information and extract valuable insights from it. Now, more and more companies are looking for data analysts to help them create actionable strategies. But what does a data analyst actually do?
In this article, we’ll go over the data analyst job description, role, and responsibilities, and illustrate what they do with a fictional case study. You’ll also learn what kind of skills, education, and career outlook you can expect if you pursue this path.
Check out our video on the topic or scroll to keep reading about the data analyst role.
Table of Contents
- What Is a Data Analyst?
- Data Analyst vs Data Scientist: Key Differences
- What Are the Responsibilities of a Data Analyst?
- What Tools Does a Data Analyst Use?
- What Does a Data Analyst Do?
- What Is the Data Analyst Job Outlook?
- What Salary Does a Data Analyst Get?
- What Skills Do You Need to Become a Data Analyst?
- What Education Level Do You Need to Become a Data Analyst?
- What Does a Data Analyst Do: Next Steps
What Is a Data Analyst?
A data analyst stores and interprets information from a dataset to uncover valuable insights. People in this role create reports and present their findings in front of business owners and stakeholders, revealing past trends and the lessons learned by observing them.
It’s important for an analyst to be able to convey complex data into comprehensive points that will help management understand their operations and make better-informed decisions.
The responsibilities of a data analyst vary depending on the company’s size and area of production, but there are several set activities that you will find in any job description. We’ll go over these in detail in the upcoming sections.
First, we need to make an important distinction.
Data Analyst vs Data Scientist: Key Differences
People often put the data analyst role under the same denominator as data scientist. Of course, both positions operate in the data realm, so there’s bound to be an overlap. But while they do share responsibilities, the two jobs vastly differ from one another. Let’s see how by examining their definitions.
As we already mentioned, a data analyst works with data to extract insights about the business. A large part of their workflow involves using statistical methods and data visualization tools to compile and present patterns to stakeholders to aid the decision-making process.

Data scientists, on the other hand, dig even deeper into the data. They use advanced machine learning techniques to analyze and even predict trends based on the available data. It’s often more complex as you need stronger mathematical and programming prowess to derive more refined, forward-looking pieces of information.

Put in simpler terms, data analysts analyze past data to create solutions, whereas data scientists aim to predict future trends and stay ahead of the curve.
What Are the Responsibilities of a Data Analyst?
As we said, the responsibilities of a data analyst vary from company to company. In smaller workspaces, for example, you might have to perform some business analyst activities or even data scientist tasks in addition to your data analyst duties.
To better define the position, we’ll go through a data analyst job description from a random open position on a job-hunting website. Here’s what they’ve included as part of the daily workflow within their organization:
- Write robust and efficient SQL queries.
- Construct clean, easy-to-understand reports and dashboards.
- Work cross-functionally with a variety of internal teams to scope, prioritize, and manage requests for ongoing reporting and ad-hoc analyses.
- Automate reporting for weekly business metrics.
- Identify areas of opportunity to automate and scale our current processes.
- Present key takeaways and implications from your analyses.
Of course, these activities aren't typical only for a data analyst, but it’s a good overview of what you can expect on the job.
What Tools Does a Data Analyst Use?
A data analyst uses a robust set of tools to achieve their goals. In order to land a job, you’ll need to get familiar with the proper technologies.
Microsoft Excel
The majority of datasets will come in a spreadsheet. Knowing how to manage data with this well-familiar tool is essential for the data analyst job description. Excel allows you to import and sort through datasets, and apply functions to uncover the insights within.
Not to mention it’s an accessible way to start learning data analysis techniques. Build or refresh your skills with our Introduction to Excel course, which teaches you the essential functionalities required to perform multi-layered calculations, create charts, manipulate data, look up functions, and more.
Programming Languages
While data analysts don’t need as much coding experience as data scientists do, it is still essential for them to know at least one programming language. The most recommended are SQL, MATLAB, and Python, where SQL is specifically built for relational database management—a crucial part of the data analysis workflow.
Data Visualization Software
As a data analyst, you’re essentially a storyteller for your company’s stakeholders. Your reports and dashboards need to be presented in professional, yet accessible ways for a non-technical audience. It is highly recommended you master tools like the data visualization powerhouse Tableau, or the leading business intelligence software Power BI.
Side note: Some data analysts, like Ina, also use PowerPoint. It’s not the most professional tool out there, but if you have nothing else on deck, and can make the report look presentable enough, it’s a good resource to have.
What Does a Data Analyst Actually Do?
We’ve gone over the data analyst responsibilities and necessary technologies, but what do they actually mean in a real-world work environment? Let’s examine a fictional scenario that clearly defines what a data analyst is and what it’s like to work as one in a fitness and well-being startup.
Data Analyst Fictional Case Description
FitVit is an ambitious startup building a unique fitness and nutrition app that provides users with workout ideas and offers a custom nutritional plan tailored to individual goals, lifestyle, and current training regime.

Before, the company operated with little performance information regarding its growth, acquisition, retention, and user activity. Developers were too busy building the product, while the business team didn’t have the necessary technical skills to analyze the data collected in the database.
The company’s founders have a background in finance, but they need to get used to working with a relational database that contains millions of rows that Excel cannot handle.
Management struggled to answer such essential questions as:
- How often do users come back to the FitVit app?
- What is the average session duration?
- Are there functions rarely used by clients?
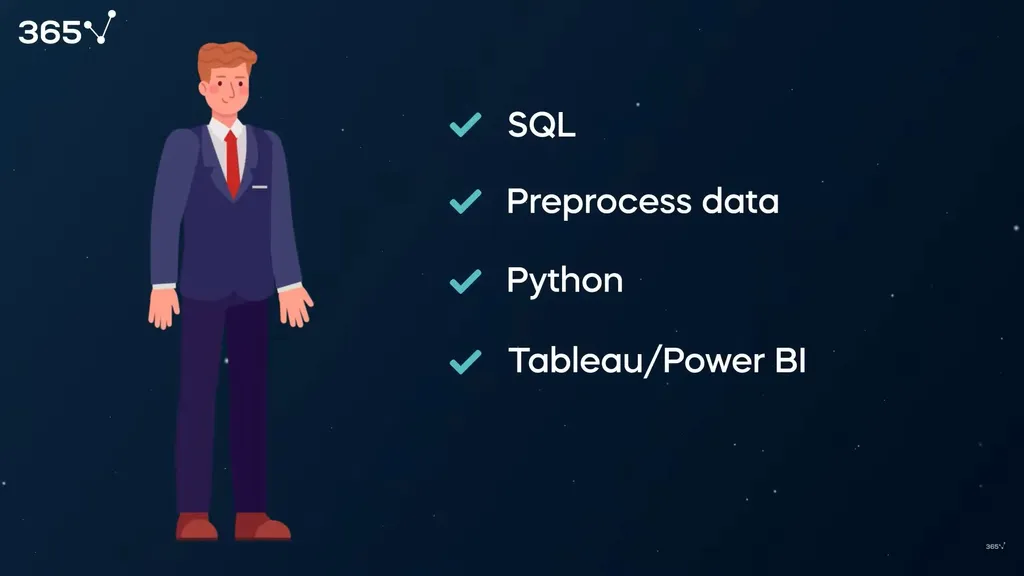
For this reason, the startup recruited a data analyst. George’s solid SQL skills, ability to preprocess data in Python, and proficiency with visualization tools like Tableau and Power BI made him the perfect candidate.
Onboarding the Data Analyst
In his first weeks on the job, George had a chance to talk to everyone on the team and gain a better understanding of the business. Given that FitVit is a relatively small company, it didn’t take long to learn how they were organized and what business logic had been incorporated into the product.
A proper introduction to the company's stakeholders is essential for every data analyst. To tackle business problems using data, the analyst needs to understand the business's challenges. Moreover, George believes that it’s always helpful to build a good rapport with other team members, as later, they’ll work together to solve actual business problems.
Taking on Ad-Hoc Data Analyst Tasks
Soon after onboarding, George received his first ad-hoc request—to analyze FitVit’s checkout process. The founders thought this was a suitable first task as any quick wins from this analysis would show the entire team the benefits of data-driven decision-making. George agreed that this analysis had the potential to create measurable business value and proceeded to explore the data collected in the database.
The analyst was glad to see that developers had built tables that collect information about all clicks made by customers during the checkout process. At the same time, he had difficulty working with the format the developers had used—code instead of meaningful names that could be analyzed and built into a funnel.
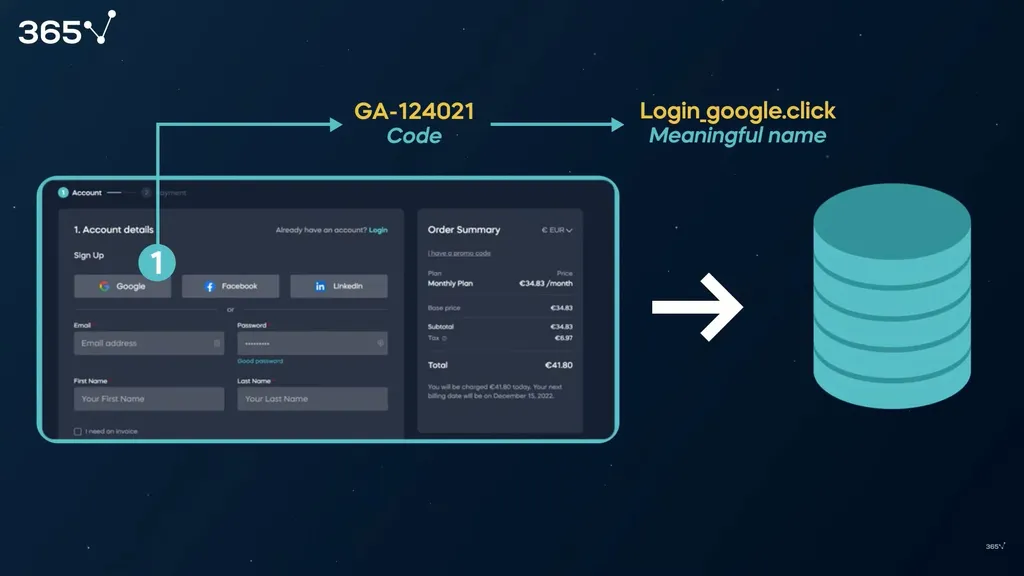
Therefore, George spent significant time mapping and preprocessing the data—assigning meaningful names to each type of action.

Once that was done, he created a funnel visualization indicating how many people initiated a checkout, how many dropped out during different stages of the process, and how many ultimately purchased the product. George was surprised to discover that many customers dropped out during the registration stage.
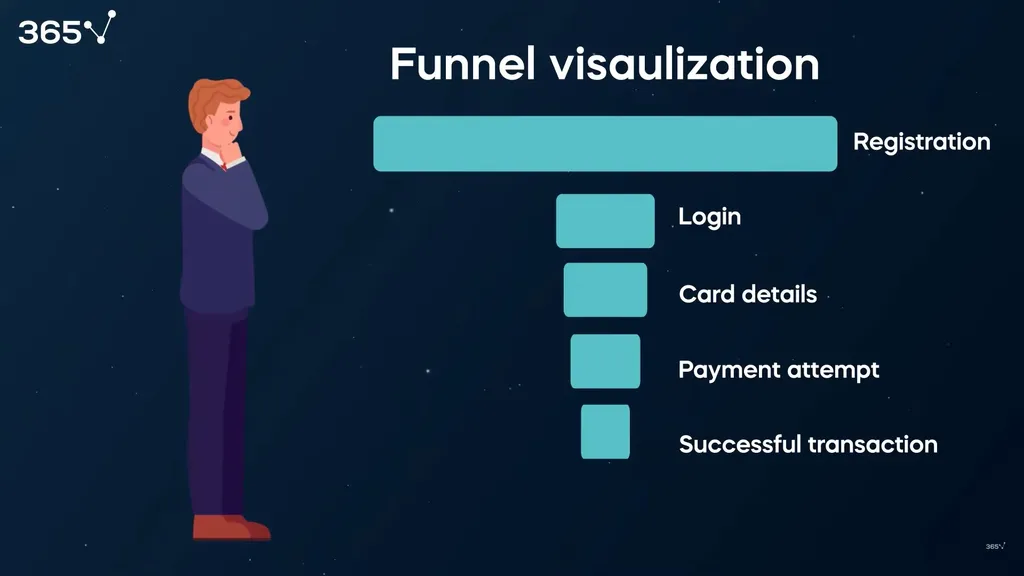
The current product design asked for too much information and 80% of users did not continue to the second stage of adding their credit card information. George presented his findings to business stakeholders. Everyone agreed they could reduce the amount of information asked at registration, saving these questions for later when clients have already invested in the product. This led to significant improvements in interactions and earned the data analyst’s first quick win.
Data Analyst Tasks and Responsibilities
Besides ad-hoc data analysis requests, George knew that a data analyst’s main responsibility was to create reports and dashboards that decision-makers and stakeholders could regularly use to satisfy their informational needs.
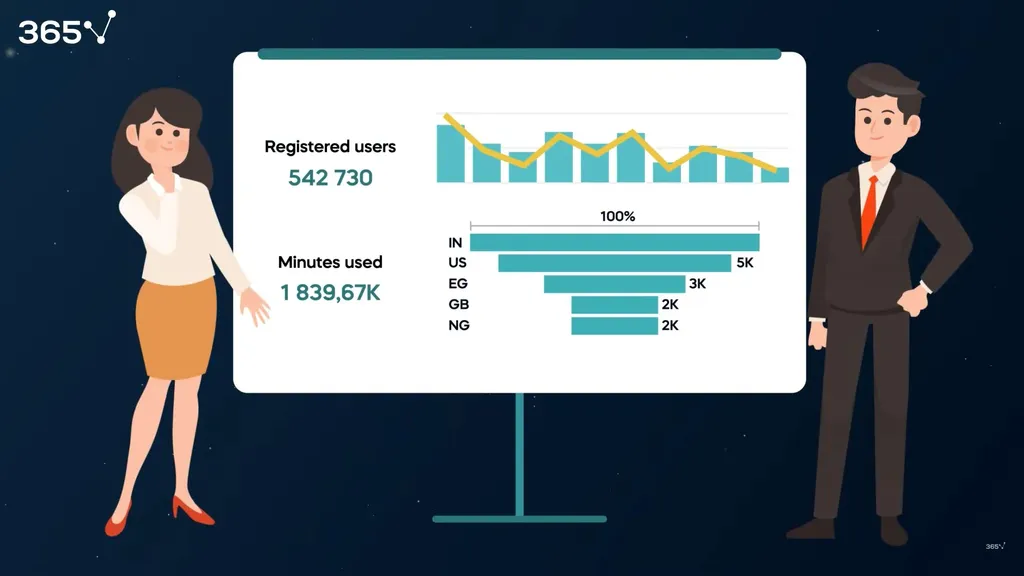
In his conversations with stakeholders, George learned that the team wasn't familiar with the users' product satisfaction levels, their app usage frequency, and whether they took advantage of its more sophisticated features.
So, George shared these observations with key decision-makers. They agreed it would be optimal to create a dashboard enabling employees to track user activity and give everyone on the team a sense of common purpose. Business stakeholders defined what key questions needed answers. The analyst continued by reflecting on the types of visualizations and KPIs to answer these questions over time.
He then built an ETL process to provide the source data for his dashboard, using internal (collected within the app) and external (via API) data sources as the company used an external payment service. Once the data was collected, it was transformed into a format that allowed for the analysis to proceed.
In SQL, George created several views, combining several data tables, which could be saved and used as a source for the visualizations in the dashboard. He used stored procedures to automate his report, as these jobs would be requested regularly.
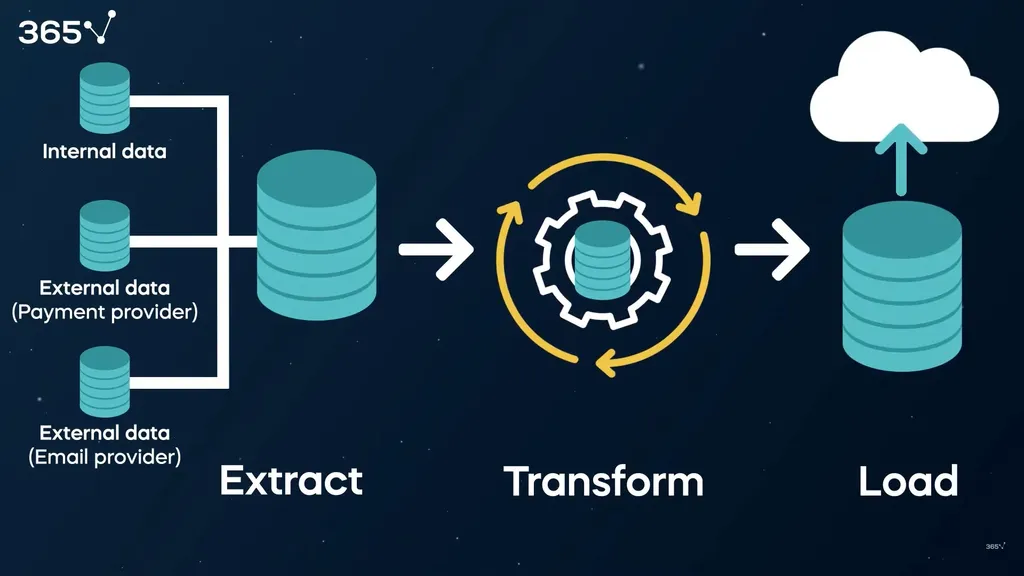
Before creating the actual visualizations, George cross-referenced data from different sources to test for mistakes and ensure solid data quality. Then it was time to create compelling charts in Tableau.
Once ready, George discussed the structure of his dashboard with the team members who would later use it—ensuring it would satisfy the informational needs of intended stakeholders.
What Is the Data Analyst Job Outlook?
You’ve read all about the data analyst position and decided it sounds like a viable option for your future career. But is there a future for it? Let’s take a look at the outlook for data analysts on the market in the upcoming years.
According to the US Bureau of Labor and Statistics, data analyst positions are expected to grow by 25% by 2030. Those are certainly powerful expectations—and great news for those who want to pursue a career in data analytics.
In terms of industry, your options are open-wide. Employers from across the board are looking for skilled data analysts to work in sectors like finance, insurance, telecommunications, and so on. Demand for this role continues will continue to increase as more and more companies realize the advantages of running a data-driven business.
What Salary Does a Data Analyst Get?
According to Glassdoor, a data analyst makes a median of $71,487 a year, with a range of $57k to $90k. Of course, this all depends on the company, job location, and level of experience you have.
For example, for entry-level data analysts, the annual salary is $54,645 with a range of $44k to $68k. Meanwhile, senior data analysts can make from $83k to $128k per year, with a median annual salary of $102,810.
What Skills Do You Need to Become a Data Analyst?
As with any profession, you need a specific skillset to outshine the competition and get the job done well. This includes both technical and soft skills.
Technical Skills
We already mentioned some of the tools data analysts use, like SQL and Tableau, but what kind of technical skills do you need alongside them? Some of them include:
- Data cleaning and preprocessing
- Data analysis
- Data visualization
- Data interpretation
Of course, you’ll rely on data analysis software and programming languages to effectively manage your datasets. Some job ads list other skills like data warehouse management and data wrangling.
You should acquire as many technical skills as you can—even those that employers list as optional—as those will give you a competitive edge during the job search.
Soft Skills
Data analytics is not just a technical-based career. As you’ve already learned, one of the main responsibilities of a data analyst is to communicate their findings to stakeholders. To be successful in this role, you need:
- Critical thinking in order to ask the most relevant questions, identify challenges, and propose creative solutions.
- Business acumen that will allow you to understand the company’s values and objectives.
- Strong communication to clearly and accurately convey insights to both technical and non-technical audiences.
- Excellent time management and organization as you’ll most probably work with multiple projects and deadlines daily.
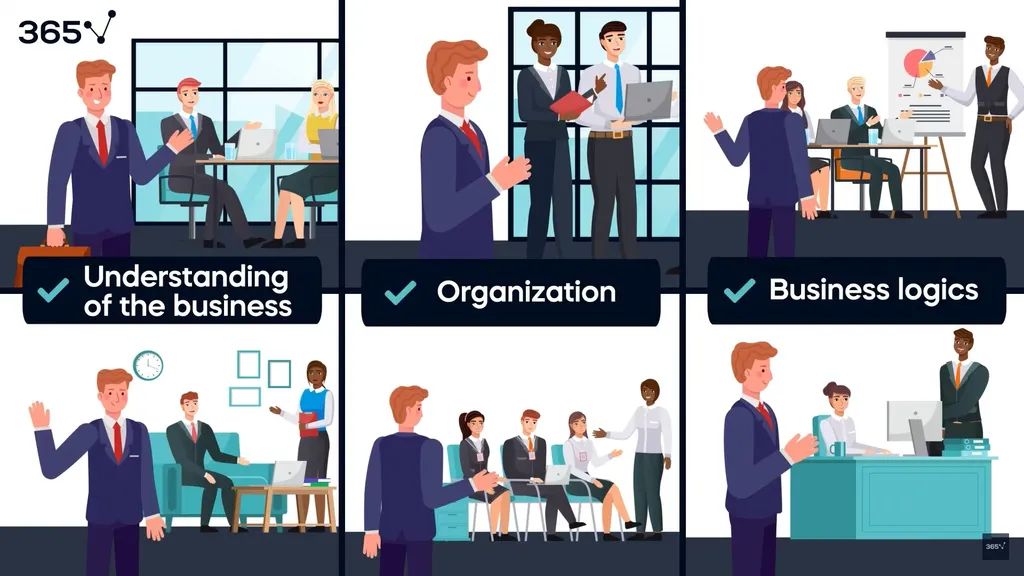
These are the main skills we recommend you work on. However, you’ll also need to be personable and a team player—it might sound cliché, but such interpersonal skills are vital for facilitating project operations and promoting a healthy work environment.
What Education Level Do You Need to Become a Data Analyst?
Most job listings require candidates to have at least a bachelor’s degree. Universities across the globe have started offering specialized data analysis programs, but employers also consider degrees in:
- Statistics
- Mathematics
- Computer science
What if you don’t have a relevant degree or any higher education at all? Well, finding a job as a data analyst in such cases would be more challenging. But with the advancements in data, the rise of online education, and the abundance of readily available digital resources, some companies are hiring their talent based on skillset alone.
A good way to gain experience is to practice your abilities with online courses, earn certificates to boost your resume, and enrich your portfolio with practical projects. Searching for open calls for data analyst interns and approaching companies asking for work opportnities are also great ways to break into the field with or without a degree.
If you want to experience a more structured approach, but a traditional data analyst degree is too inaccessible for you, we highly recommend our Data Analyst Career Track. It is designed to streamline your learning journey from the fundamentals to more advanced machine learning specialization and ensure you’ve got a real fighting chance amidst the steep competition. After you’ve passed all the exams in the track, you’ll obtain an industry-recognized certificate that shows recruiters and hiring managers you’re qualified for the position.
Q&A
What Does a Data Analyst Actually Do: Next Steps
With exponential expected growth and high-paying positions, a data analyst career is a great option for people who want to make a difference with data, regardless of the industry sector. Not to mention, the data analyst role is an amazing gateway to a data science career.
If you’re looking for a place to start, 365 Data Science is the best platform for you. With an ever-growing catalog of courses, we provide expert data science and data analysis education for everyone who wants to break into the field. Learn the fundamentals like statistics, mathematics, and probability, build in-demand skills in Excel, SQL, and Power BI, and get the right certification to land a job as a data analyst. Sign up now and try a selection of free lessons to get a taste of the 365 teaching style.


![Data Analyst Job Outlook 2025 [Research on 1,000 Job Postings]](https://365datascience.com/resources/blog/thumb@360_ciqytcbcw5e-the-data-engineer-job-market-thumb-1.webp)

