Author’s Note: This article was originally published in 2017 and offers valuable insights and perspectives based on the available knowledge at the time of its publication. For the latest information, check out our most recent research on The Data Scientist Job Market in 2024.
So, you want to become a data scientist? Good idea! Data science is a super-hot topic and the data scientist is one of the most illustrious jobs of the 21st century. But how does one actually become a data scientist?
You can ask around, read Quora answers, or talk to someone in the industry. Sure, these methods will supply you with information, but there’s no doubt that this information will be biased towards someone else’s personal experience. How others became data scientists is of little importance to you, I bet. What you’re interested in is whether you can become one. Are your skills appropriate for this field? What steps do you need to take to become a successful data scientist? Will your background affect the chances of becoming a data scientist? All valid questions.
So, let’s not talk about how we at 365 data science became data scientists, instead, let’s approach things a little differently:
If you want to become a data scientist, you should answer questions like one.
A data scientist wouldn’t take the experience and background of just one or two other data scientists and accept them as a quintessential guide. So, how much data would be statistically adequate to give us an idea of what it takes to become a data scientist? 100 profiles? 500? How about 1,001? Well, that’s exactly what we did.
We gathered data from 1,001 publicly listed LinkedIn profiles of data scientists. We can safely assume that one’s LinkedIn profile is an unbiased estimator of one’s CV. Therefore, with a reasonable degree of scientific certainty, we found some amazing insights. Insights that we are excited to share with you.
One data scientist for all and all data scientists for one!
Aggregate data for a research of this type is the best data, as it will keep any personal records of the data scientists private while highlighting the main drivers of their career success. This way we bypass any personal influences that don’t relate to you.
Here is a list of all our findings. You can read the whole research or jump to whichever part you find most interesting, your choice:
- Summary
- Level of education
- Level of education and work experience
- Previous jobs
- Academic degree
- University ranking
- Self-preparation and online courses
- Online courses and university ranking
- Programming languages
- Country of employment and programming languages
- Country of employment and industry
- Country of employment and academic degree
- Country of employment and work experience
- Company size and programming language
- Company size and university ranking
Author's note: If you are interested in pursuing a career in data science, then you would definitely want to check out our free data science career guide
1. Summary
What does a typical data scientist look like?
Data scientists come in many shapes and sizes, but of course, there is going to be an average. This doesn’t mean that you need to fit this profile exactly to become a data scientist. Instead, try to find yourself within the data!
Males generally dominate the field, this could be for many reasons which I won’t speculate on but what I do know is that this does not automatically make men better (or worse) at the job or more (or less) likely to get hired.
Usually, data scientists speak two languages but if English is your first or second language (which I’m assuming it is as you understand what I’m saying) then you’re good.
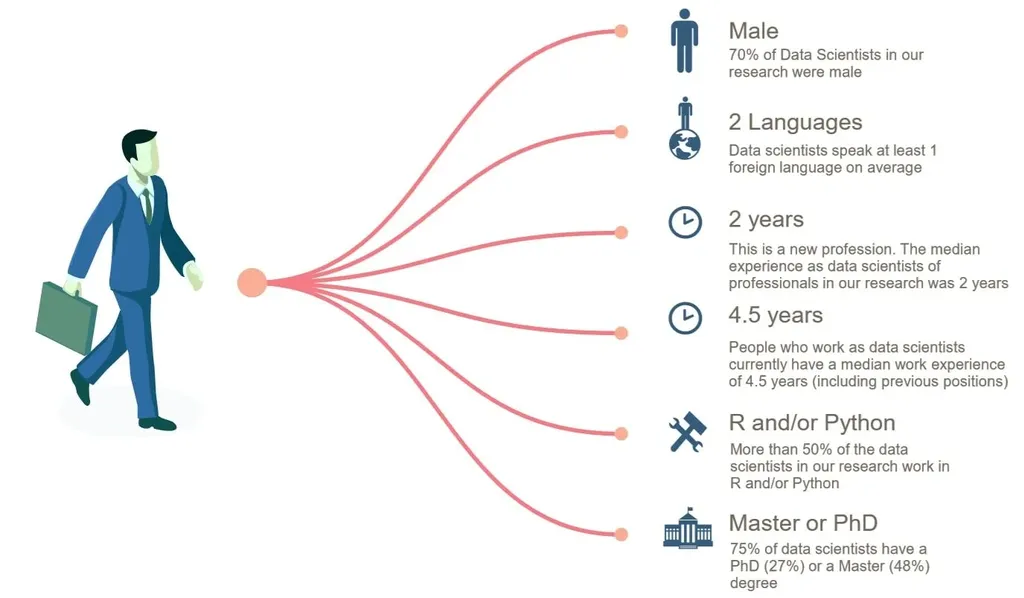
An interesting but not unexpected result is the median experience of the data scientist title – 2 years. The term “data science” has been around for no more than 10 years, so we can’t expect data scientists to outdate their own field!
What’s more, the length of time the typical data scientist has been in any employment is 4.5 years. This means on average it takes 2.5 years to become a data scientist.
Great! It seems that getting yourself into data science is much quicker than in other fields.
2. Level of education
For many people, education is at the forefront of their thoughts. Do you need a PhD to become a data scientist?
Although the name suggests that you do, this is not necessarily the case.
We found that while a significant chunk of data scientists has a PhD degree, a Master’s is sufficient. 48% of the entire sample hold a Master’s degree. Bachelor’s degrees also, although less common, are not absent. There are even couple of MBAs and this one person who graduated as a doctor and then became a data scientist!

We can see that having a PhD is an advantage, but perhaps there’s another way to become a data scientist… How about starting as an intern!
3. Level of education and work experience
While we don’t know the success rate of interns, we do know that 18% of the data scientists reached the top of the ladder within just two jobs after completing their internship; 65% of those had a Master’s degree. 
So, if you have a Master’s, taking the 4-year PhD track may not be as essential as you think. Perhaps looking for intern positions is the right move for you.
4. Previous jobs
So, an Internship is one option, right? What other ways are there to get the title?
Take a look at this graph of the previous job titles held by current data scientists:
The previous position of people currently working as a Data Scientist

The previous position of people currently working as a Data Scientist
There you go, the best way to become a data scientist is to already be one! It’s that ol’ chestnut!
“Can’t get experience without a job, can’t get a job without experience!”
Don’t lose hope just yet though, not only are there several big job clusters from which we get most of the data scientists: analysts (data analyst, BI analyst, business analyst included), scholars, interns, IT specialists, and consultants. We have also had a look at the previous positions of those who were data scientists before getting their current data scientist position.

'Previous-previous' position of people whose previous job was also Data Scientist
Well, what do you know? It looks practically the same!
Granted, if you’re already a data scientist, you’re more likely to land yourself a data science job. But if you are already a data scientist, why are you reading this article?
I will assume you are not a data scientist already, but even if you are, you would have come from a varying group of other positions – analyst, academia, internship, IT or consulting.
It can be deduced that PhDs are likely to go through academia, while Masters’ on average will go through the analyst, intern, or IT positions.
We’re going to take a step back now and have a look at the big picture and see if there are any patterns when we view the ‘previous-previous’ positions of the whole group.

What seemed interesting to us was that IT was more common than consulting, for instance. So, solid programming knowledge sounds like something worth looking into. Maybe education isn’t such a bad idea after all.
What are your thoughts on that?
That’s right! I shouldn’t be asking you, I should be asking the data!
5. Academic degree
So, let’s ask the data.
We’ve established how the ‘average data scientist’ achieved the title and the type of degree they obtained. It would be logical now to check what exactly they studied at university.
It makes sense that there is little to no formal ‘data science education’; If on average, current data scientists acquired the title 2 years ago and their working life started 4.5 years ago, it seems likely that they didn’t study data science at college because the occupation is simply too new.
In our sample, we had 500+ academic degrees. Of course, we had to cluster them in some way. We identified 7 clusters. They are not completely different, but we can say: they are different enough.
The clusters are:
- Economics and Social Sciences
- Statistics and Mathematics
- Natural Sciences (Physics, Chemistry, Biology)
- Data Science and Analysis (which includes Machine Learning)
- Computer Science (which excludes Machine Learning)
- Engineering
And … of course…
- Other
So, what were the findings?

As you can see, there isn’t a single field that jumps out as a more successful area that the others. This is good news, it seems almost any degree can lead you to become a data scientist. Just make sure it is essentially quantitative. A musical theater degree may not benefit you as much as a statistics one.
The largest concentration of data scientists has a degree from the computer science cluster (worth noting, however, is that we included Machine Learning in the Data Science cluster, rather than the Computer Science one. Had we done otherwise, Computer Science would have had a higher share).
Logically, the runner-ups are mathematicians and statisticians. A popular definition of the data scientist job is:
‘The data scientist is a better statistician than most programmers, and a better programmer than most statisticians’
This quote may be quite close to the true definition of the profession.
But…
Don’t be disheartened if you are a business or economics major. The “Economics and Social Sciences” cluster is holding its own nicely. We did anticipate a strong presence in the field, but not as much. So how about we adjust the definition slightly:
‘A data scientist is a better statistician and economist than most programmers, a better programmer and economist than most statisticians, and a better statistician and programmer than most economists’
Why doesn’t the data science cluster have a higher standing? Especially since we are talking data scientists here!
While the ‘Data Science and Analysis’ cluster is lagging at 10% of our sample, it is a relatively new field, so it is playing catch up. This can prove difficult when universities are not ready to meet the high job market demand for data scientists currently taking place. Thus, this data may look very different in 10 years.
I have now shown you data on the ‘how’ (previous positions and relevant experiences) and the ‘what’ (academic achievements and fields of study).
Now it’s time for the ‘where’.
6. University ranking
So, where did data scientists graduate from?
We used the ‘Times Higher Education World University Ranking’ to find where our data scientists’ universities stood. It seems that better universities are indeed producing more data scientists, just like in most high-paying jobs. So, taking all universities in the Times ranking, we noticed the anticipated trend:

When you read the diagram, keep in mind that the clusters are of different sizes!!!
There is a fascinating detail though. 25% of the data scientists come from universities that weren’t even ranked by the Times. That figure is almost equal to the number of people who came from top 50 universities!
Another unexpected and intriguing result! Data science never fails to surprise us!
Clearly, university matters but not excessively. As with the discipline of your degree, where you graduated from does have an impact but no-where near as much as some professions. Take investment banking, for example, having graduate students from non-ranked universities working in this field would be practically unheard of.
Data scientists seem to have the ability to enter the job based on their knowledge, rather than the signal their education is sending. So long signalling theory!
So, not only is the degree of the average data scientist ‘something quantitative’, but the ranking of their university is ‘somewhere there’.
This is great news so far for aspiring data scientists such as yourself.
7. Self-preparation and online courses
With data scientists coming from so many different backgrounds, how on earth did they gain the knowledge to perform the job?
Well, that’s what we wondered, too!
They certainly took time to self-prepare, but how to measure this was slightly problematic; Certificates from online courses which have been posted on the data scientists’ LinkedIn profiles seemed like a sensible avenue to pursue. We assume one would and could not post an online course certificate if they hadn’t completed it.
However, it likely does not supply conclusive results; while we found that 40% of the data scientists have included an online course, it is presumed that not all data scientists would post courses they have completed; I, for instance, haven’t posted the first machine course I completed on my LinkedIn profile as it is no longer necessary.

At least 40% posted one or more online courses.
What about the total number of certifications? The data is equivocal. There is a median of 0, a mode of 0, but the mean is 3.3 certificates. We can deduct from this that some data scientists relied heavily on extra-curricular education, while others did not.

What can we do with this information then?
We could probably see some interesting results if we check out who relied on online courses and who didn’t. It’s logical that data scientists who went to higher ranked universities would be less willing to take an online course, isn’t it? Or maybe they are the keenest learners in general, so they were constantly taking online courses? I’m sure the data will tell us.
8. Online courses and university ranking
Using the same ranking as before, we visualized this interesting relationship.

As we already said 40% of our sample have shown they have taken online courses and remember the university ranking clusters you see are not of the same size so comparability is somewhat restricted. It is useful to compare them to the average, though.
Let’s review them in turn.
Those data scientists who graduated from higher ranking universities don’t seem to desire or need that many extra qualifications. Interestingly, the ones graduating from second-tier universities (51-100th in the ranking) were even less likely to engage in extra education.
The biggest insight we get is that data scientists from the lowest ranked universities and the ones coming from schools that were not ranked at all are significantly above the average in terms of online course taking.
We have now got a good idea of how graduates acquire the skills to become a data scientist. But how does this translate to the real world? Which are the data scientist skills employers actually look for? Of course, data has the answer.
9. Programming skills
We took note of the top 3 data science-related endorsements data scientists had in their profile. It is pretty clear that they favoured showing off their programming languages.
So which ones stood out?
R, Python and SQL.
This echoes all other research out there. But confirmatory research is reliable, so here you go.
Similar to what others before us have found, R and Python are the most commonly used languages. Statistically, based on our sample they are equally used by just over 50% of data scientists. We don’t have a large enough sample to state that one is better than the other or how much each one is used, but they are the most popular skills to have.

The 3rd most popular programming language is SQL. Database handling is an essential part of the data scientist’s job, so unsurprisingly 40% of the professionals in our sample ‘speak’ SQL.
Since it is skills we are talking about, it is useful to dig a bit deeper. MATLAB, Java, and C/C++ are the next languages in line.
Personal opinion alert! – MATLAB is mostly used by older generations and scholars; it is becoming a little outdated. R and Python have overtaken and are way out in front. MATLAB usage will be most likely to decline even more, while Python is expected to grow in the years to come.
Finally, Java and C/C++ are definitely driven by IT specialists. Most professionals who learn to code and are headed for a data science career would normally go for Python and R. The payoff to invest your time in Java and C/C++ is just doesn’t seem worth it in the current situation.
We’re going to talk now about the factors that come in to play depending on your location when you become a data scientist.
You might think it can’t make much of a difference where you work but let me show you the results and then you can decide.
If you are interested in learning, you could start by the fundamental such as How to Think Like a Data Scientist to Become One and Python Programmer Bootcamp.
10. Country of employment and programming skills
In our research, we looked at the data scientist’s present country of employment, not their country of origin.
We have divided the sample into four regions: the US, UK, India and Others, due to the sampling method we used (see below).
So? What are our findings? A noticeable trend is that the coding revolution seems to follow the GDP of these countries. The higher the GDP, the more modern the data science tools they employ.

In the US, data scientists rely mainly on R, Python, and SQL. Only 30% of data scientists use tools like MATLAB, SAS, SPSS, Scala, etc. These results closely parallel the general finding in this regard.
In the UK, things work a bit differently. 40% of the UK data scientist skillset is attributed to other tools. So, traditional coding languages like Java, C/C++, and MATLAB are still standing strong. Python, R, and SQL are still leading but by a narrower margin.
Finally, in India, SQL is the number one skill. Similar to the UK, people working in India rely less on R and Python, and more on the traditional languages. Now, why would that be?
11. Country of employment and industry
Different countries have different specialities, right? So, maybe the industries where these countries flourish require the data scientists to apply different skills and use distinct bundles of tools.

Well, industry surely explains a large part of the variability.
People employed in India work predominantly in the Technological/IT sector. The presence of ex-IT specialists and CS graduates is considerable, and naturally, they have had access to a plethora of coding languages which mathematicians or economists didn’t really have the time to learn.
In the US, the sample is almost equally split between the tech and industrial clusters (industrial involves retail, energy, FMCG, etc.).
The situation in the UK is similar, but slightly larger is the Financial sector. Well, London is one of the strongest financial centres in the world, at the moment. It makes sense that the Brits bet on data-driven finance.
In the financial sector though, the programming knowledge required differ somewhat from the typical data scientist skillset. Languages like Java and C/C++ are more valuable.
Going back to the previous graph (and looking into the data absent from the graph), UK-based data scientists massively reported MATLAB and LaTeX as their “featured skills & endorsements”.
Why would you feature LaTeX as one of your top 3 skills? Because these skills are popular among scholars! Maybe there is a correlation to be found here…
12. Country of employment and academic degree
And indeed, there is - the UK is the number 1 PhD employer. Remember the average? On average, 27% of data scientists have a PhD. Make that 37% average in the UK. Tough competition, Europe.

The US and the ‘Others’ have averages the mirror the general results we found earlier. In India, however, Things look very different, no need for a PhD, guys! Even a Bachelor’s could be sufficient!
It looks as though to become a data scientist in India requires a lower level of education. But how does that translate when it comes to actual work experience?
13. Country of employment and work experience
Which location leads to the fastest career progression? To get that insight, it is worth looking at the experience that the data wizards had before achieving their dream of becoming a data scientist.

It looks as though India and the UK are the places to be right now. With 22% of the data scientists having just 0-12 months of prior experience!
But remember the UK is also PhD club! Data scientists don’t have much experience, but they probably have a bunch of publications…
In the US, the field looks more mature. You work hard for a longer period of time and then you become a data scientist. Even without a PhD.
Speaking of ‘mature’, we decided to contrast giant Fortune 500 companies with other firms (startups, or small to medium enterprises, and big non-F500 companies).
14. Company size and programming language
In terms of coding languages, F500 is lagging behind.
Unsurprising.

Fortune 500 firms rely heavily on established corporate languages such as SAS and are reluctant to adopt R and Python.
Most importantly, they don’t use SQL as much, since Hadoop proves to be more useful to them. And logically so. Big data is king there.
All this information has probably got you thinking. Can you become a data scientist in a F500 company given your education so far?
15. Company size and university ranking
Remarkably, university ranking doesn’t make a difference when it comes to the data scientist’s employer.

Data scientists are needed everywhere! In F500 companies and in tech startups!
Author's note: Interested to find which top companies are on the search for data scientists? Check out our article 15 Data Science Consulting Companies Hiring Now.
I am quietly confident, by looking at this graph, that personal skills and self-preparation are the strongest factors when it comes to becoming a successful data scientist!
You’ve made it to the end of the article! Congratulations! So, with a certain degree of certainty, I can assume that you would like to become a data scientist. After all the data we’ve shown you, you feel that you could make an outstanding data scientist. And you know what? You’re right!
One more thing...
Let us give some insight into how we carried out this extensive study…
We conducted our own research on the topic. Our study involved 1,001 LinkedIn resumes of data scientists. The rather large sample was divided into two groups depending on whether the person was employed by a Fortune 500 Company or not (roughly equal groups). This way we were able to compare F500 companies and non-F500. Further, the sample involved data scientists working in the US (40%), UK (30%), India (15%), and other (15%). Thus, the data was collected from data scientists with various backgrounds to limit bias. The country quotas were chosen the way they were according to preliminary research on the most popular countries for data science, where information is public.
So, before you go off and choose the best way to begin (or continue) your journey. Let us just say, good luck!
Ready to take the first step towards a career in data science?
Check out the complete Data Science Program today. We also offer a free preview version of the Data Science Program. You’ll receive 12 hours of beginner to advanced content for free. It’s a great way to see if the program is right for you.