Search Results for: #小程序://牧羚森-Moolisten/TkFN5J6qrkjazpF
Discover over 0 free data science resources to simplify your learning journey. Enhance your data and AI training with comprehensive study materials, career guidance, and expert advice.
What Is the Central Limit Theorem? Infographic
The Central Limit Theorem (CLT) is a fundamental concept in statistics. But what exactly is the Central Limit Theorem? The Central Limit Theorem definition states that the distribution of sample means approximates a normal distribution as the sample size increases, regardless of the underlying population distribution. Understanding what the Central Limit Theorem says is crucial for statistical inference and probability theory. If you want to develop a deeper understanding of this concept, this Central Limit Theorem infographic provides a comprehensive overview of CLT in statistics, including its definition and why it matters. This resource also explains when to use the Central Limit Theorem and demonstrates how it works in real-world scenarios. It also addresses important considerations about Central Limit Theorem sample size requirements and helps clarify common misconceptions about normal distributions. Download our free Central Limit Theorem infographic to get an easy-to-reference guide that breaks down this essential statistical concept into clear, understandable components.
Learn More
AI Interview Guide
Set yourself up for success in artificial intelligence with our AI Interview Guide—a comprehensive collection of AI interview questions to help you excel and land your dream role. This guide is tailored for aspiring and experienced AI professionals and provides everything you need to prepare for the most demanding AI interview scenarios. What’s Inside? Comprehensive Question Sets: Gain access to a curated list of AI interview questions and answers—ranging from general artificial intelligence questions to specialized topics like generative AI, NLP, and computer vision interview questions. Role-Specific Guidance: Whether you’re preparing for such roles as AI Engineer, AI Project Manager, or AI Research Scientist, this guide is packed with questions and insights relevant to your career aspirations. Practical Advice and Real-World Examples: Learn how to confidently respond to challenging questions and showcase your expertise via practical examples and actionable tips. Interview Preparation Essentials: From foundational questions about AI to advanced problem-solving scenarios, this guide ensures you’re fully prepared for technical and behavioral interview stages. Download the guide and take the next step toward securing your place in the dynamic and rewarding world of artificial intelligence.
Learn More
Machine Learning Engineer Career Guide 2026
Discover your pathway to becoming a machine learning engineer with our comprehensive career guide—designed to equip you with the essential knowledge and skills needed to land your dream job in this field. This guide provides an in-depth overview of the machine learning engineer career—detailing everything from the key roles and responsibilities to the essential skills and qualifications required. Here’s what’s included: Discover what machine learning engineers do daily, which can help you determine if this is the right career for you. Gain insights into the current ML engineer job market, learn about various career paths, and understand the educational and professional milestones needed to excel. Learn the machine learning engineer requirements and discover how to create an impressive portfolio with this comprehensive guide. Receive practical advice on: Crafting a standout resume Preparing for machine learning engineer interviews Effectively networking to enhance your job prospects With sections dedicated to beginners and experienced professionals, our guide ensures you have all the resources needed to pursue a successful machine learning career path. Download this machine learning engineer career guide now to discover how you can shape your future in one of the most promising careers in the tech industry.
Learn More
Intro to AI Course Notes
Our Intro to AI Course Notes provides a thorough overview of artificial intelligence fundamentals to help you master foundational concepts and get started with advanced techniques. These notes are an essential part of our Intro to AI course and cover a wide range of topics—from machine learning basics to deep learning and AI techniques—offering a solid foundation for anyone interested in AI. Key topics discussed: AI Fundamentals: Natural vs Artificial Intelligence, history, and critical concepts Data in AI: The role of structured and unstructured data and data collection methods AI Techniques: Machine learning (supervised, unsupervised, reinforcement) and deep learning AI Branches: Robotics, computer vision, and generative AI Generative AI and NLP: Development of language models and advancements in NLP These AI lecture notes are a valuable resource for students and professionals that will help you understand the intricacies of artificial intelligence and prepare you for various AI job roles. If you wish to explore AI and understand what it takes to succeed in this rapidly evolving field, download our Intro to AI Course Notes for a comprehensive guide.
Learn More
Machine Learning Engineer Cover Letter Template
Our machine learning engineer cover letter template provides a structured and effective way to showcase your qualifications for roles in machine learning and artificial intelligence. Designed for clarity and impact, this template highlights your experience, skills, and achievements—ensuring your cover letter stands out. It includes a professional introduction, detailed sections to outline your relevant expertise, and a strong closing statement that conveys your enthusiasm for the role. With this machine learning engineer cover letter, you can confidently apply to any position, presenting yourself as a well-qualified candidate ready to make an impact. Download this cover letter template for free to boost your job-search this year.
Learn More
SQL DELETE Statement Notes
Our SQL DELETE Statement notes provide a comprehensive guide to the SQL DELETE Statement—essential for removing unwanted data from your databases. What is the SQL DELETE Statement? The SQL DELETE statement is a fundamental SQL command that deletes existing records in a database. These notes explain the syntax needed to write effective DELETE SQL queries. You’ll learn about the DELETE FROM WHERE conditions command, which allows you to specify the exact SQL rows to delete. Understanding how to delete a row in SQL is crucial for maintaining clean and efficient databases. One of the critical aspects covered in these notes is the ON DELETE CASCADE option, which is part of the foreign key constraint. This option ensures that if a specific value from the parent table’s primary key is deleted, all corresponding records in the child table will also be removed. This feature is essential for maintaining referential integrity within your database. The notes also compare the SQL DELETE command with other SQL commands for removing data, such as TRUNCATE and DROP. The section on TRUNCATE vs DELETE highlights the differences in performance and usage scenarios between these two commands. The DROP vs TRUNCATE vs DELETE section also provides insights into when to use each command for optimal database management.
Learn More
SQL UPDATE Statement Notes
Our SQL UPDATE Statement notes offer a comprehensive guide to the SQL UPDATE Statement—essential for modifying existing data in your databases. What is the SQL UPDATE Statement? The SQL UPDATE is a crucial SQL command used to modify existing records in a database. These notes provide detailed information on the syntax needed to write effective SQL UPDATE statements. You learn about the UPDATE table_name SET column_1 = value_1 command, which allows you to update specific columns, and the SQL WHERE condition, which ensures you only update the desired records. Additionally, this guide covers SQL best practices for handling database updates to provide accurate and efficient data management. You can execute precise and controlled updates by mastering the SQL UPDATE syntax and understanding the use of TCL commands. The notes explore the TCL COMMIT and TCL ROLLBACK commands—essential for managing transactions in SQL. The COMMIT statement saves the transaction in the database, while the ROLLBACK clause allows you to revert to the last committed state, ensuring your data remains consistent and accurate.
Learn More
SQL Insert Statement Notes
Our SQL INSERT Statement Notes offer a comprehensive guide to the SQL INSERT Statement—essential for adding new data to your databases. What is the SQL INSERT Statement? The SQL INSERT statement is a vital SQL command to add new records to a database. This resource provides detailed information on the syntax needed to write effective INSERT statements. You can learn how to update your database and add new information, including the INSERT INTO statement—allowing you to add data to specific columns—and the INSERT INTO SELECT command, which facilitates inserting data from one table into another. Download these SQL INSERT Statement notes to thoroughly understand one of SQL's most essential commands. With this resource, you'll confidently manage and add data to databases—ensuring your data management practices are efficient and effective.
Learn More
SQL SELECT Statement Notes
Our SQL Select Statement notes offer an in-depth exploration of the SQL SELECT statement—essential for effectively querying and retrieving data from databases. What is the SQL Select Statement? The SQL SELECT statement is fundamental in SQL—allowing you to extract specific data from a database. This resource covers the core syntax required to write effective SELECT statements, including using SELECT FROM and the WHERE clause to filter data. You learn about the AND operator and OR operator for combining multiple conditions and understand operator precedence to ensure your queries return the correct results. Additionally, this resource explains how to use wildcard characters to search for patterns within your data and the BETWEEN AND clause for selecting values within a specific range. The IS NULL and IS NOT NULL conditions help you handle missing data, while various comparison operators allow precise data filtering.
Learn More
SQL Syntax & Theory Notes
SQL (Structured Query Language) encompasses a wide array of SQL commands that allow for comprehensive management and manipulation of databases. This resource explores the intricacies of SQL syntax and SQL commands, detailing: Data Definition Language (DDL) Data Manipulation Language (DML) Data Control Language (DCL) Transaction Control Language (TCL) It offers comprehensive insights into interacting with database objects. Key topics cover SQL syntax fundamentals—including basic structure and rules for crafting queries, essential SQL keywords for mastering SQL operations—and various statement types like CREATE, ALTER, DROP, RENAME, and TRUNCATE. By mastering these SQL commands and SQL keywords, you'll be well-prepared to handle any database-related task efficiently.
Learn More
World of Open-Source Generative AI Infographic
The rise of artificial intelligence and its generative capabilities have transformed how we develop, deploy, and interact with AI solutions. Our World of Open-source Generative AI infographic provides a comprehensive overview of critical open-source AI tools and resources shaping the future of AI. From foundational models to orchestration tools, this visually appealing infographic details the open-source generative AI landscape—highlighting the advantages and considerations for each category. In this free downloadable AI infographic, you’ll explore the following elements critical to open-source generative AI. Foundation Models: Understand the role of large, pre-trained models like LLaMA and GPT-2 and how they’re used as bases for further adaptation. Datasets: Learn about open-source datasets crucial for training and validating AI models. Vector Databases: Discover how these databases facilitate quick and scalable similarity searches. Orchestration Tools: See how tools streamline the construction of LLM-powered applications. Evaluation Tools: Assess AI model performance and reliability with cost-effective solutions like DeepEval, deepchecks, arize, and Langdock. Community and Ethics: Engage with the vibrant AI community and understand the ethical frameworks guiding open-source AI development.
Learn More
SQL Notes: Basics
Our SQL Basics Resource offers a comprehensive overview of essential SQL concepts and commands—crucial for anyone looking to master database management and manipulation. Download our free SQL PDF and get started with SQL notes to help you understand the core of this essential query language. What is SQL? SQL (Structured Query Language) is the standard language for managing and manipulating databases. These SQL notes explore the language’s core elements, such as SQL Query Structure and essential commands for effective database interaction. They introduce: Data Definition Language (DDL) Data Manipulation Language (DML) Data Control Language (DCL) Transaction Control Language (TCL). This guide covers SQL Syntax—essential structures and rules for crafting queries. Learn to: Retrieve data with the SQL SELECT statement. Modify data using the SQL UPDATE statement. Add new entries with the SQL INSERT statement. Remove data via the SQL DELETE statement. You’ll also find information on SQL keywords, helping you familiarize yourself with essential terms and their uses. Additional topics include GROUP BY and HAVING—exploring grouping data and filtering group results—and the WHERE clause, which explains how to specify conditions for data retrieval. Explore SQL operators and SQL wildcards to refine queries, including SQL BETWEEN and SQL comparison operators for range-based selection and comparisons. This resource also explains SQL DISTINCT for filtering unique values and the distinctions between SQL TRUNCATE and SQL DELETE, which detail methods for removing data and deleting tables. The SQL PDF covers SQL GRANT and REVOKE for user permissions and database security, along with SQL database administration techniques for effectively managing and maintaining your databases.
Learn More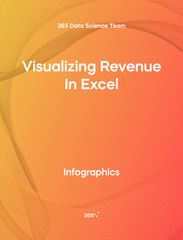
15 Ways to Visualize Revenue
Our Excel revenue visualization template offers a comprehensive array of data visualization examples—perfect for understanding your data more intuitively. What is the Excel revenue visualization template? This template is an expansive tool for visualizing revenue data in Excel—providing 15 different visualization methods and examples tailored to diverse analytical needs and presentation styles. It includes all kinds of revenue graphs—from straightforward column and pie charts to more complex data visualization methods like waterfall and Pareto charts. Each revenue chart provides a unique perspective on data, making it a versatile tool for data science students, researchers, and enthusiasts needing to present or understand complex data comprehensively. Simply input your data into any of the following revenue charts to visualize your revenue in Excel. Column chart: Revenue development over time Sparklines chart: Revenue development over time Treemap chart: Revenue by product over time Stacked area chart: Demonstrate the contribution of revenue components Clustered column chart: Show revenue split by category and over time Pie chart: Revenue breakdown in a single period Doughnut chart with total: Revenue breakdown in a single period with total Waterfall chart: Compare annual revenue in a year-over-year growth chart Scatter plot: Plot revenue vs marketing spend Bubble chart: Compare the number of products by company and revenue Combo chart: Track revenue development and margins over time Pie of Pie: Provide a macro and a micro breakdown Map chart: Geographical distribution of revenue Pareto chart: Cumulative revenue contribution by revenue category Funnel chart: Website conversion rate You can choose the ideal method to visualize and extract valuable insights from your data, such as revenue growth charts or breakdowns according to categories like location.
Learn More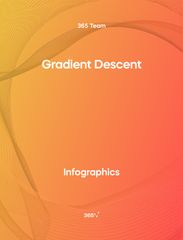
Gradient Descent Infographic
Our Gradient Descent Infographic provides an in-depth overview of an essential method widely applied in machine learning. What is Gradient Descent? Gradient Descent is an optimization algorithm that finds the local minimum of a function. It’s used in machine learning for cost function minimization. Gradient descent is essential to various machine learning models used by data scientists and machine and deep learning engineers. The infographic offers a well-rounded definition of gradient descent, machine learning applications, and the method's intuition. It further outlines the step-by-step process of the gradient descent algorithm—starting with initial coefficient values and repeating the process until converging on a minimum. The infographic also highlights the gradient descent assumptions and compares the pros and cons of stochastic gradient descent—a variant that updates the coefficients more frequently.
Learn More
Regularization Infographic
Our regularization infographic provides a comprehensive overview of an essential machine-learning technique. Regularization is a technique that helps prevent models from overfitting by introducing constraints into the loss function. For instance, in logistic regression, regularization techniques can be used to optimize the model's performance. The infographic provides a clear, concise definition of regularization, highlighting its role in balancing overfitting and underfitting. It illustrates how adding noise and improving generalization enhance model performance on new data. It also gives in-depth look at various regularization methods, including L1 regularization (Lasso regularization) and L2 regularization (Ridge regularization). It explains their formulas and how they influence coefficient adjustment in model training. Additionally, the infographic explores Elastic Net, a method blending Ridge and Lasso regularization, along with a 2-stage regularization process.
Learn More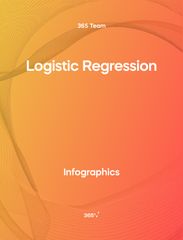
Logistic Regression Infographic
This logistic regression infographic provides a clear and comprehensive overview of a standard statistical method used to predict binary outcomes. Unlike simple linear regression, logistic regression excels at deciphering the connection between multiple independent variables and one dependent variable. It simplifies the comprehension of intricate data relationships, making it a perfect gateway to machine learning. Logistic regression handles non-linear relationships effectively, delivering robust results without intricate hyperparameter adjustments.
Learn More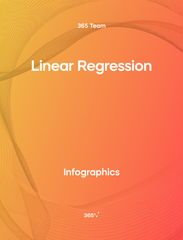
Linear Regression Infographic
This Linear Regression infographic demystifies the principles behind a standard statistical model used in machine learning—showing how to predict and understand linear variable relationships. It depicts its mathematical formula, training process, and practical applications with examples. Are you struggling to recall the linear regression assumptions? Unsure when to apply linear regression in machine learning? Download our infographic for an instant cheat sheet.
Learn More
Data Science Shortcuts Cheat Sheet
Discover how to boost your productivity using this data science shortcuts cheat sheet with over 2,000 workarounds in Python IDEs, such as Jupyter, Spyder Rodeo, PyCharm, and Atom, compatible with various operating systems. Amplify your proficiency in R with R Studio shortcuts, streamline MATLAB operations, and manage databases efficiently with SQL shortcuts. Enhance data visualization in Tableau, easily manage Excel spreadsheets, and conduct statistical analyses seamlessly in SPSS and SAS. This data science shortcuts cheat sheet lets you speed up your everyday tasks while achieving your goals.
Learn More
How to Learn AI. A Beginner's Guide
Recent technological developments have spurred both excitement about the world of opportunities and fear of becoming obsolete. While the adoption of artificial intelligence has led to the automation of many tasks, new roles continue to emerge daily. Upskilling is the only way to stay current in this AI-driven world, and those who know how to adapt and leverage new technologies will thrive in the future job market. Our comprehensive How to Learn AI guide helps you navigate the dynamic work environment by introducing you to a future-proof strategy for getting started with AI.
Learn More
How to Prompt ChatGPT Effectively
ChatGPT is a powerhouse AI algorithm transforming how we lead, work, and brainstorm. By typing our desired output as a prompt into ChatGPT, the generative AI model returns an actionable, informed response that meets your needs. Accelerate your productivity by learning how to interact with this indispensable tool. Our How to Prompt ChatGPT Effectively infographic is a structured resource that guides you in creating effective prompts for ChatGPT. Construct practical prompts that generate insightful responses and inspire creative solutions. To boost your productivity and stay current, you must take advantage of the best tools at your disposal. So, start engaging with ChatGPT like a pro and future-proof your skills.
Learn More
When, What, Why of AI
Artificial intelligence is becoming a household discussion, yet it’s still widely misunderstood. Our When, What, Why of AI infographic aims to demystify the concept by answering the most popular questions: What is artificial intelligence? How does it work? Who invented AI? Who uses AI models? We’ve divided the AI infographic into two separate categories in terms of methodology: rule-based and statistical. Learn what АI concepts like deep learning, NLP, and computer vision mean and when they were first popularized. You’ll also discover what models they’re based on and the main AI applications. Finally, we introduce AI pioneers whose contributions have shaped—and continue to shape—the tech-advancement landscape.
Learn More
AI Ethics Consideration
As deep learning and artificial intelligence rapidly evolve, it’s essential to consider how their development affects the broader community. In other words, we shouldn’t ignore the ethics of AI and its implications. With this informative AI Ethics Considerations infographic, we look at the ethics in artificial intelligence to answer the question, “Is AI actually ethical?” By examining scenarios like copyrighted materials and biased data through the AI lens, we present potential ethical issues for companies and end users. This resource aims to create a broader conversation about the development of a more responsible and ethical use of AI models. Artificial intelligence will continue to shape our future, and we should harness the transformative power that automatization brings us. We also present a list of potential remedies to facilitate a more considerate approach that caters to the broader human experience and creates more ethical AI models.
Learn More
ABCs of AI and Deep Learning
Artificial intelligence is a trending topic that intrigues and perplexes. But what is it, and how does it work? Our comprehensive ABCs of AI and Deep Learning Infographic introduces you to the basics of artificial intelligence through its deep learning foundations. Arranged alphabetically, this glossary provides an overview of essential terms and phrases that define deep learning and AI concepts. Each letter of the alphabet represents methodologies, such as convolutional neural networks, natural language processing, and Xavier initialization. Use the ABCs of AI and Deep Learning Infographic to foster your curiosity and navigate the complexities of these transformative technologies.
Learn More
Data Analyst Career Guide
Understanding and interpreting data has become more crucial as we progress into the digital age. Data analysts use their skills to analyze complex datasets and provide valuable insights that drive informed decision-making and promote business growth. Our data analyst career guide explores what it takes to become a successful data analyst, including the role description, necessary qualifications and skills, and the data analyst job outlook for 2023. The true value of the guide is in its extensive section concerning your application process from resume to interview. You’ll learn how to structure your resume, write a winning cover letter, and provide exceptional answers to data analyst interview questions.
Learn More
Data Analyst Resume Template
A winning data analyst resume must be brief, easy to scan, mistake-free, and tailored to a particular job ad. But building one from scratch can be time-consuming. Our free data analyst resume template is the perfect resource to slash formatting time and allow for quick customization.
Learn More
Data Analyst Cover Letter Template
Crafting an effective data analyst cover letter begins with skimming through a massive dataset: your experience. Demonstrate your value to the hiring manager by crafting a compelling story about your skills and experience. Our free data analyst cover letter template allows you to use a tried-and-tested method for impressing employers.
Learn More
Multi-Dimensional Dictionaries in Python
The following is a program implementing a multi-dimensional dictionary in Python. The notebook shows how to retrieve keys and values from the dictionary, how to create a new key:value pair and how to loop through the keys and the values using a for-loop. Some other related topics you might be interested in are One-Dimensional Dictionaries in Python, Dictionary Comprehension in Python, Using Counter - a Dictionary Subclass in Python. The Multi-Dimensional Dictionaries in Python free template is among the topics covered in detail in the 365 Program.
Learn More
Methods in Python - Functions Inside Classes in Python
In Python, we can design and create our own objects with the help of classes. In this free notebook, we will design a class and define two functions inside - two methods. In Python, methods are accessed through the dot-notation. They help interact with an object and are an essential part of a class. Some other related topics you might be interested in are Defining classes in Python, The Pass-Statement in Python, Creating a Constructor in Python - the INIT method, Class Variables in Python, Inheritance in Python. The Methods in Python – Functions Inside Classes in Python template is among the topics covered in detail in the 365 Program.
Learn More
Inheritance in Python
In Python, we can design and create our own objects. This is done with the help of classes. The design of these (parent) classes can be inherited by other classes. This allows classes to make use of the constructor and the methods of the parent class. In this notebook, we demonstrate how this can be done with a thorough example. Some other related topics you might be interested in are Defining classes in Python, The pass-statement in Python, Creating a constructor in Python - the INIT method, Class variables in Python, Methods in Python - functions inside classes. The Inheritance in Python template is among the topics covered in detail in the 365 Program.
Learn More![Yellow cover of Indexing with.iloc[] and .loc[] in Python. This template resource is from 365 Data Science.](https://365datascience.com/resources/resources/thumb@240_d39kb37f1qb-indexing-with-iloc-and-loc-in-python-365-data-science.jpg)
Indexing with.iloc[] and .loc[] in Python
The following template demonstrates how to perform indexing with the pandas methods iloc[] and loc[].Some other related topics you might be interested in are Data Selection in Python, Common Attributes for Working with DataFrames in Python, Attribute Chaining in Python, Ordering the Rows from a Data Table According to the Values in a Column in Python, and Converting Series into Arrays in Python. The Indexing with.iloc[] and .loc[] in Python template is among the topics covered in detail in the 365 Program.
Learn More
Data Selection in Python
The following template demonstrates how to extract elements, rows, columns, or just a subset from a DataFrame object. Some other related topics you might be interested in are Delivering an Array with the Unique Values from a Dataset in Python, Ordering the Rows from a Data Table According to the Values in a Column in Python, Attribute Chaining in Python, Common Attributes for Working with DataFrames in Python, Indexing with.iloc[] and .loc[] in Python. The Data Selection in Python template is among the topics covered in detail in the 365 Program.
Learn More
Common Attributes for Working with DataFrames in Python
The following template demonstrates the application of important pandas attributes when cleaning, preprocessing, and analyzing a dataset. Some other related topics you might be interested in are Data Selection in Python, Indexing with.iloc[] and .loc[] in Python, Delivering an Array with the Unique Values from a Dataset in Python, Converting Series into Arrays in Python, and Using Pandas Methods for Working with Series Objects in Python. The Common Attributes for Working with DataFrames in Python template is among the topics covered in detail in the 365 Program.
Learn More
Attribute Chaining in Python
The following template demonstrates how to use several attributes at once. Some other related topics you might be interested in are Common Attributes for Working with DataFrames in Python, Data Selection in Python, Indexing with.iloc[] and .loc[] in Python, Converting Series into Arrays in Python, and Delivering an Array with the Unique Values from a Dataset in Python. The Attribute Chaining in Python template is among the topics covered in detail in the 365 Program.
Learn More
Ordering the Rows from a Data Table According to the Values in a Column in Python
The following template demonstrates how to convert Series objects into pandas and NumPy arrays. Some other related topics you might be interested in are Ordering the Rows from a Data Table According to the Values in a Column in Python, Attribute Chaining in Python, Common Attributes for Working with DataFrames in Python, Data Selection in Python, and Indexing with.iloc[] and .loc[] in Python. The Ordering the Rows from a Data Table According to the Values in a Column in Python template is among the topics covered in greater detail in the 365 Program.
Learn More
Converting Series into Arrays in Python
The following template demonstrates how to convert the pandas Series to a NumPy Array using this function. Despite being quite straightforward, this approach has a highly original premise. since we are aware that the Series' output has an index. In contrast, NumPy arrays simply contain their elements. Some other related topics you might be interested in are Ordering the Rows from a Data Table According to the Values in a Column in Python, Indexing with.iloc[] and .loc[] in Python, Data Selection in Python, Common Attributes for Working with DataFrames in Python. The Converting Series into Arrays in Python template is among the topics covered in detail in the 365 Program.
Learn More
Obtaining Descriptive Statistics about the Data in Python
The following template demonstrates how to obtain an overview about the dataset. It shows the application of the .describe() method on a pandas Series object. Some other related topics you might be interested in are Delivering an Array with the Unique Values from a Dataset in Python, Converting Series into Arrays in Python, Ordering the Rows from a Data Table According to the Values in a Column in Python, Data Selection in Python, and Common Attributes for Working with DataFrames in Python. The Obtaining Descriptive Statistics about the Data in Python template is among the topics covered in detail in the 365 Program.
Learn More
Creating DataFrames in Python
The following template demonstrates how to create a DataFrame from various datatypes. Some other related topics you might be interested in are Obtaining Descriptive Statistics about the Data in Python, Delivering an Array with the Unique Values from a Dataset in Python, Converting Series into Arrays in Python, Ordering the Rows from a Data Table According to the Values in a Column in Python, and Data Selection in Python. The Creating DataFrames in Python template is among the topics covered in detail in the 365 Program.
Learn More
Using Pandas Methods for Working with Series Objects in Python
The following template demonstrates the application of some of the most widely used pandas methods for working with Series objects. Some other related topics you might be interested in are Creating DataFrames in Python, Obtaining Descriptive Statistics about the Data in Python, Delivering an Array with the Unique Values from a Dataset in Python, Converting Series into Arrays in Python, Ordering the Rows from a Data Table According to the Values in a Column in Python, and Data Selection in Python. The Using Pandas Methods for Working with Series Objects in Python template is among the topics covered in detail in the 365 Program.
Learn More
Dealing with Indexing in Python
This template shows how to perform various operations regarding indexing in Python. Some other related topics you might be interested in are Using Pandas Methods for Working with Series Objects in Python, Creating DataFrames in Python, Obtaining Descriptive Statistics about the Data in Python, Delivering an Array with the Unique Values from a Dataset in Python, and Ordering the Rows from a Data Table According to the Values in a Column in Python. The Dealing with Indexing in Python template is among the topics covered in detail in the 365 Program.
Learn More
Position-Based and Label-Based Indexing in Python
This template shows the difference between position-based and label-based indexing in Python. It demonstrates its application on pandas Series. Some other related topics you might be interested in are Dealing with Indexing in Python, Creating a Series Object from a List in Python, Delivering an Array with the Unique Values from a Dataset in Python, Converting Series into Arrays in Python, Ordering the Rows from a Data Table According to the Values in a Column in Python and Attribute Chaining in Python. The Position-Based and Label-Based Indexing in Python template is among the topics covered in detail in the 365 Program.
Learn More
Indexing in Pandas Python
This template demonstrated the concepts behind indexing in Python by giving pandas objects as an example. Some other related topics you might be interested in are Position-Based and Label-Based Indexing in Python, Dealing with Indexing in Python, Using Pandas Methods for Working with Series Objects in Python, Ordering the Rows from a Data Table According to the Values in a Column in Python, and Attribute Chaining in Python. The Indexing in Pandas Python template is among the topics covered in detail in the 365 Program.
Learn More
Using Attributes in Python
This template shows how to use attributes for gathering information about different Objects - in particular - pandas Series. Some other related topics you might be interested in are Using Pandas Methods for Working with Series Objects in Python, Creating DataFrames in Python, Delivering an Array with the Unique Values from a Dataset in Python, Converting Series into Arrays in Python, and Ordering the Rows from a Data Table According to the Values in a Column in Python. The Using Attributes in Python template is among the topics covered in detail in the 365 Program.
Learn More
Creating a Series Object by Using a NumPy Array in Python
This template shows how to convert a NumPy array into a Series. First, you import the Pandas and NumPy libraries, after which you create an array containing four integer values. Then you turn the array into a series and finally you check the type of the object. Some other related topics you might be interested in are Using Attributes in Python, Indexing in Pandas Python, Position-Based and Label-Based Indexing in Python, and Dealing with Indexing in Python. The creating a Series Object by Using a NumPy Array in Python template is among the topics covered in detail in the 365 Program.
Learn More
Creating a Series Object from a List in Python
This template shows how to convert a list object into a Series in the popular Pandas library. Some other related topics you might be interested in are Creating a Series Object by Using a NumPy Array in Python, Using Pandas Methods for Working with Series Objects in Python, Obtaining Descriptive Statistics about the Data in Python, Delivering an Array with the Unique Values from a Dataset in Python, and Ordering the Rows from a Data Table According to the Values in a Column in Python. The Creating a Series Object from a list in Python template is among the topics covered in detail in the 365 Program.
Learn More
Importing the Pandas Library in Python
This template demonstrates how to import the pandas library in Python- a popular open-source library that provides high-performance structures and data analysis tools. Some other related topics you might be interested in are Indexing in Pandas Python, Using Attributes in Python, Using Pandas Methods for Working with Series Objects in Python, and Creating DataFrames in Python. The Importing the Pandas Library in Python is among the topics covered in detail in the 365 Program.
Learn More
Converting Timezones in Python
This free open-access template shows how to convert date and time values between the different time zones in Python. Some other related topics you might be interested in are Local Time and Universal Time in Python, Importing the Pandas Library in Python, Creating a Series Object by Using a NumPy Array in Python, and Using Attributes in Python. The Converting Timezones in Python template is among the topics covered in detail in the 365 Program.
Learn More
Local Time and Universal Time in Python
This is an open-access template demonstrating how to estimate the local time and compare it to universal time in Python. Some other related topics you might be interested in are Converting Timezones in Python, Converting between Timezones in DataFrames, Importing the Pandas Library in Python, and Creating a Series Object from a List in Python. The Local Time and Universal Time in Python template is among the topics covered in detail in the 365 Program.
Learn More
Converting Images into Arrays
The following template teaches you one way to convert an image file to an array (tensor). This is extremely useful in ML and Computer Vision, as these fields require images as data, however, the algorithms can only work with numbers and arrays. Some other related topics you might be interested in are Tensorboard - Tracking Metrics in Python, Tensorboard - Confusion Matrix in Python, Tensorboard - Tuning Hyperparameters in Python, and A Simple CNN Network - Convolutional Layer in Python. The Converting Images into Arrays in Python is among the topics covered in great detail in the 365 Data Science Program.
Learn More
TensorBoard - Tuning Hyperparameters in Python
This template demonstrates how one can tune the hyperparameters of their network model using TensorBoard. Hyperparameter tuning is important aspect of Machine Learning and being able to do it automatically can be a time saver. TensorBoard provides other visualization options, as well. Some other related topics you might be interested in are Dropout in Python, L2 Regularization and Weight Decay in Python, Converting Images into Arrays, and A Common CNN Architecture in Python. The TensorBoard – tuning Hyperparameters in Python.
Learn More
TensorBoard – Confusion Matrix in Python
The confusion matrix is an essential tool when trying to solve classification problems. There are many different ways to construct such a matrix. In the following template we show you how one can create and visualize the confusion matrix with the help of TensorBoard and sklearn. Some other related topics you might be interested in are TensorBoard - Tuning Hyperparameters in Python, Converting Images into Arrays, L2 Regularization and Weight Decay in Python, and Dropout in Python. The TensorBoard template is among the topics covered in detail in the 365 Program.
Learn MoreTensorBoard - Tracking Metrics in Python
The following is a program used to demonstrate how to log different metrics in Tensorboard for visualization later. An example CNN network is used. The TensorBoard callback is defined to log the loss function and accuracy during training. Then, the extension is loaded in order to visualize these metrics. Some other related topics you might be interested in are TensorBoard - Confusion Metrics in Python, TensorBoard - Tuning Hyperparameters in Python, Converting Images into Arrays. The TensorBoard - Tracking Metrics in Python template is among the topics covered in the 365 Data Science Program.
Learn More
A Common CNN Architecture in Python
Convolutional Neural Networks are a powerful choice for problems and datsets involving images. However, they can grow to become so big, that training it on a normal system takes too long. So, the following template shows a particular network architecture that can be very effective for most problems, but is also small enough to be trained quickly. Some other related topics you might be interested in are Pooling Layers in Python, Tensorboard - Tracking Metrics in Python, Tensorboard - Confusion Metrics in Python, and Tensorboard - Tuning Hyperparameters in Python. The Common CNN Architecture in Python template is among the topics covered in detail in the 365 Program.
Learn More
Pooling Layers In Python
Pooling Layers are an important part of a Convolutional Neural Network (CNN). That's why, the following template demonstrates how one can add a MaxPooling layer to the network architecture, as well as discuss the important parameters that need to be considered and included. Some other related topics you might be interested in are Simple CNN Network - Convolutional Layer in Python, A Common CNN Architecture in Python, TensorBoard - Tracking Metrics in Python, and Tensorboard - Tuning Hyperparameters in Python. The Pooling Layers in Python template is among the topics covered in detail in the 365 Program.
Learn More
A Simple CNN Network - Convolutional Layer in Python
This template demonstrates how one can add convolutional layers to our network in order to create a Convolutional Neural Network (CNN).. Some other related topics you might be interested in are Pooling Layers in Python, A Common CNN Architecture in Python, Tensorboard - Tracking Metrics in Python, and Tensorboard - Tuning Hyperparameters in Python. The template is among the topics covered in detail in the 365 Program
Learn More
Excel Mechanics
Imagine if you had to apply the same Excel formatting adjustment to both Sheet 1 and Sheet 2 (i.e., adjust font, adjust fill color of the sheets, add a couple of empty rows here and there) which contain thousands of rows. That would cost an unjustifiable amount of time. That is where advanced Excel skills come in handy as they optimize your data cleaning, formatting and analysis process and shortcut your way to a job well-done. Therefore, asses your Excel data manipulation skills with this free practice exam.
Learn More
Formatting Excel Spreadsheets
Did you know that more than 1 in 8 people on the planet uses Excel and that Office users typically spend a third of their time in Excel. But how many of them use the popular spreadsheet tool efficiently? Find out where you stand in your Excel skills with this free practice exam where you are a first-year investment banking analyst at one of the top-tier banks in the world. The dynamic nature of your position will test your skills in quick Excel formatting and various Excel shortcuts
Learn More
Hypothesis Testing
Whenever we need to verify the results of a test or experiment we turn to hypothesis testing. In this free practice exam you are a data analyst at an electric car manufacturer, selling vehicles in the US and Canada. Currently the company offers two car models – Apollo and SpeedX. You will need to download a free Excel file containing the car sales of the two models over the last 3 years in order find out interesting insights and test your skills in hypothesis testing.
Learn More
Confidence Intervals
Confidence Intervals refers to the probability of a population parameter falling between a range of certain values. In this free practice exam, you lead the research team at a portfolio management company with over $50 billion dollars in total assets under management. You are asked to compare the performance of 3 funds with similar investment strategies and are given a table with the return of the three portfolios over the last 3 years. You will have to use the data to answer questions that will test your knowledge in confidence intervals.
Learn More
Fundamentals of Inferential Statistics
While descriptive statistics helps us describe and summarize a dataset, inferential statistics allows us to make predictions based off data. In this free practice exam, you are a data analyst at a leading statistical research company. Much of your daily work relates to understanding data structures and processes, as well as applying analytical theory to real-world problems on large and dynamic datasets. You will be given an excel dataset and will be tested on normal distribution, standardizing a dataset, the Central Limit Theorem among other inferential statistics questions.
Learn More
Fundamentals of Descriptive Statistics
Descriptive statistics helps us understand the actual characteristics of a dataset by generating summaries about data samples. The most popular types of descriptive statistics are measures of center: median, mode and mean. In this free practice exam you have been appointed as a Junior Data Analyst at a property developer company in the US, where you are asked to evaluate the renting prices in 9 key states. You will work with a free excel dataset file that contains the rental prices and houses over the last years.
Learn More
The Ultimate Data Science Career Guide
Have you ever asked yourself, “Is data science a good career choice?”, “What are the best industries for data science?”, “What are the different data science jobs?”, and “How do I get a job in data science?“? Our Ultimate Data Science Career Guide provides the answers to all data science career-related questions. This free PDF is your ultimate career advisor. You can turn to it for help during the different stages of your data science journey.
Learn More
Jupyter Notebook Shortcuts
In this free practice exam you are an experienced university professor in Statistics who is looking to upskill in data science and has joined the data science apartment. As on of the most popular coding environments for Python, your colleagues recommend you learn Jupyter Notebook as a beginner data scientist. Therefore, in this quick assessment exam you are going to be tested on some basic theory regarding Jupyter Notebook and some of its shortcuts which will determine how efficient you are at using the environment.
Learn More
Intro to Jupyter Notebooks
Jupyter is a free, open-source interactive web-based computational notebook. As one of the most popular coding environments for Python and R, you are inevitably going to encounter Jupyter at some point in you data science journey, if you have not already. Therefore, in this free practice exam you are a professor of Applied Economics and Finance who is learning how to use Jupyter. You are going to be tested on the very basics of the Jupyter environment like how to set up the environment and some Jupyter keyboard shortcuts.
Learn More
Black-Scholes-Merton Model in Python
The Black Scholes formula is one of the most popular financial instruments used in the past 40 years. Derived by Fisher, Black Myron Scholes and Robert Merton in 1973, it has become the primary tool for derivative pricing. In this free practice exam, you are a finance student whose Applied Finance is approaching and is asked to perform the Black-Scholes-Merton formula in Python by working on a dataset containing Tesla’s stock prices for the period between mid-2010 and mid-2020.
Learn More
Python for Financial Analysis
In a heavily regulated industry like fintech, simplicity and efficiency is key. Which is why Python is the preferred choice for programming language over the likes of Java or C++. In this free practice exam you are a university professor of Applied Economics and Finance, who is focused on running regressions and applying the CAPM model on the NASDAQ and The Coca-Cola Company Dataset for the period between 2016 and 2020 inclusive. Make sure to have the following packages running to complete your practice test: pandas, numpy, api, scipy, and pyplot as plt.
Learn More
Python Finance
Python has become the ideal programming language for the financial industry, as more and more hedge funds and large investment banks are adopting this general multi-purpose language to solve their quantitative problems. In this free practice exam on Python Finance, you are part of the IT team of a huge company, operating in the US stock market, where you are asked to analyze the performance of three market indices. The packages you need to have running are numpy, pandas and pyplot as plt.
Learn More
Machine Learning with KNN
KNN is a popular supervised machine learning algorithm that is used for solving both classification and regression problems. In this free practice exam, this is exactly what you are going to be asked to do, as you are required to create 2 datasets for 2 car dealerships in Jupyter Notebook, fit the models to the training data, find the set of parameters that best classify a car, construct a confusion matrix and more.
Learn More
Regular Expressions in Python
In this template you will find a list of the most commonly used regular expressions as well as a link to the Python documentation website, where the full list is stored. We will start with a simple example demonstrating the function of the compile(), match(), and search() methods. After that, more complicated regular expressions are constructed. Some other related topics you might be interested in are String formatting in Python, Bubble Sort in Python, Linear search in Python, Binary Search in Python. The Regular Expressions in Python template is among the topics covered in detail in the 365 Data Science Program.
Learn More
Insertion Sort in Python
The following template demonstrates how to implement an insertion sort function in Python. Some other related topics you might be interested in are Bubble sort in Python, Linear search in Python, Binary search in Python, and Sets and operations with sets in Python. The Insertion Sort in Python is among the topics covered in detail in the 365 Data Science Program
Learn More
Binary Search in Python
The following notebook demonstrates how to implement a binary search function(also knows as half interval) in Python. Some other related topics you might be interested in are Bubble sort in Python, Linear search in Python, and Sets and operations with sets in Python. The Binary Search in Python is among the topics covered in detail in the 365 Data Science Program
Learn More
Linear Search in Python
The following Jtemplate demonstrates how to implement a linear search function in Python. Some other related topic you might be interested in Bubble sort in Python, Insertion sort in Python, Binary search in Python, Sets and operations with sets in Python are Bubble Sort in Python, Insertion Sort in Python, Binary Search in Python, Sets and Operations with Sets in Python. The Linear Search in Python template is among the topics covered in detail in the 365 Data Science Program.
Learn More
Sets and Operations with Sets in Python
The following template demonstrates the difference between lists and sets in Python, and includes examples. Some other related topics you might be interested in are Linear search in Python, Binary search in Python, Insertion sort in Python, Bubble sort in Python. The Set and Operations with Sets in Python Template is among the topics covered in detail in the 365 Data Science Program.
Learn More
The Enumerate Function in Python
The following notebook demonstrates how to iterate through a list more effectively using the enumerate() built-in function in Python. Some other related topics you might be interested in are The zip function in Python, Defining functions in Python - the Fibonacci sequence, Recursion in Python - the Fibonacci sequence and Defining Classes in Python. The Enumerate Function in Python template is among the topics covered in detail in the 365 Data Science Program.
Learn More
Writing a Text on Top of an Image with PIL in Python
The following notebook demonstrates how to put a text on a picture having a specific position, font and color. Some other related topics you might be interested in are Line and Scatterplots with matplotlib in Python, Opening and Displaying an Image with PIL and Matplotlib in Python, Cropping an Image with PIL in Python, Resizing an image with PIL in Python, Converting a Color image to Grayscale with PIL in Python, Blurring an Image with PIL in Python. The Writing a Text on Top of an Image with PIL in Python template is among the topics covered in the 365 Data Science Program.
Learn More
Blurring an Image with PIL in Python
The following notebook demonstrates how to blur an image to a desired extend with the help of the PIL library in Python. This is done by making use of a certain image filter. A link to a list of all image filters in the PIL library is provided. Some other related topics you might be interested in are Line and Scatterplots with matplotlib in Python, Opening and Displaying an Image with PIL and Matplotlib in Python, Cropping an Image with PIL in Python, Resizing an Image with PIL in Python, Converting a Color Image to Grayscale with PIL in Python, Writing a Text on Top of an Image with PIL in Python. The Blurring an Image with PIL in Python template is among the topics covered in detail in the 365 Data Science Program.
Learn More
Converting a Color Image to Grayscale with PIL in Python
The following notebook demonstrates how to convert a colored image into a grayscale one with the help of the PIL library in Python. This is done by applying a certain conversion mode. A link to a list of all conversion modes is also provided. Some other related topics you might be interested in are Line and Scatterplots with matplotlib in Python, Opening and Displaying an image with PIL and Matplotlib in Python, Cropping an Image with PIL in Python, Resizing an Image with PIL in Python, Blurring an Image with PIL in Python, Writing a Text on Top of an Image with PIL in Python. The Converting a Color Image to Grayscale with PIL in Python template is among the topics covered in detail in the 365 Data Science Program.
Learn More
Resizing an Image with PIL in Python
The following template demonstrates how to resize an image in Python given height and width. Some other related topics you might be interested in are Data Analysts, Data Scientists, Data Architects, Data Engineers, Big Data Engineers, Big Data Architects, BI Developers, Machine Learning Engineers and more. The Resizing an Image with PIL in Python template is among the topics covered in detail in the 365 Data Science Program.
Learn More
Cropping an Image with PIL in Python
The following notebook demonstrates how to crop a rectangular section of an image with the help of the PIL library in Python. Some other related topic you might be interested in are Line and Scatterplots with matplotlib in Python, Opening and Displaying an Image with PIL and Matplotlib in Python, Resizing an Image with PIL in Python, Converting a Color Image to Grayscale with PIL in Python, Blurring an Image with PIL in Python, Writing a Text on Top of an Image with PIL in Python. The Cropping an Image with PIL in Python template is among the topics covered in detail in the 365 Data Science Program.
Learn More
Opening and Displaying an Image with PIL and Matplotlib in Python
The following notebook demonstrates how to display an image using Python and how to extract information about its size, format and mode. Some other related topics you might e interest4d in are Line and Scatterplots with matplotlib in Python, Cropping an Image with PIL in Python, Resizing an Image with PIL in Python, Converting a Color image to Grayscale with PIL in Python, Blurring an Image with PIL in Python, Writing a Text on Top of an Image with PIL in Python. The Opening and Displaying an Image with PIL and Matplotlib in Python template is among the topics covered in detail in the 365 Data Science Program.
Learn More
Class Variables in Python
In Python, we can design and create our own objects. This is done with the help of classes. The following template shows how to implement a simple class consisting of a constructor and a class variable. Some other related topics you might find interesting are The pass-statement in Python, Creating a constructor in Python - the INIT method, Methods in Python - functions inside classes, Inheritance in Python, and Defining classes in Python. The Class Variables in Python template is among the topics covered in detail in the 365 Data Science Program.
Learn More
Creating a Constructor in Python - the INIT Method
In this free Jupyter notebook, we create a class and define a constructor through the __init__ method. This helps control the variables that enter an object. We then define two different instances of this class and show how to retrieve information from them. Some other related topics you might be interested in are Defining classes in Python, The pass-statement in Python, Class variables in Python, Methods in Python - functions inside classes, and Inheritance in Python. This Creating a Constructor in Python- the INIT Method template is among the topics covered in detail in the 365 Data Science Program.
Learn More
Defining Classes in Python
In Python, we can design and create our own objects. This is done with the help of classes. In this template notebook, we define a very simplistic class without a body and create an object which is an instance of that class. Finally, we store and retrieve information from that object. Some other related topics you might be interested in are Creating a constructor in Python - the INIT method, The pass-statement in Python, Class variables in Python, Methods in Python - functions inside classes, Inheritance in Python. The Defining Classes in Python template is among the topics covered in the 365 Data Science Program.
Learn More
The Pass-Statement in Python
This free template helps your code writing by showing you the ability to define a function, a class, a loop or an if-statement but leave it empty for the time-being. This is what the pass-statement allows us to do. Some other related topics you might be interested in are Defining classes in Python, Creating a constructor in Python - the INIT method, Class variables in Python, Methods in Python - functions inside classes, Inheritance in Python. The Pass-Statement in Python template is among the topics covered in detail in the 365 Program.
Learn More
Recursion in Python - the Fibonacci Sequence
Functions in Python have the ability to call themselves. This is what we call a recursion. In this template you will find an implementation of the Fibonacci sequence using recursion. Some other related topics you might be interested in are Recursion in Python - the Fibonacci sequence, The pass-statement in Python, Methods in Python - functions inside classes. The Recursion in Python - the Fibonacci Sequence in Python is among the topics covered in detail in the 365 Program.
Learn More
Defining Functions in Python - the Fibonacci Sequence
In this notebook you will find examples of function definitions with and without returning a value. You will find an implementation of the Fibonacci sequence which returns the n-th Fibonacci number, where n is a number determined by the user and understand the purpose of a docstring. Some other related topics you might be interested in are The enumerate function in Python, Using Counter - a dictionary subclass in Python, and One-Dimensional Dictionaries in Python template. The Defining Functions in Python - the Fibonacci Sequence Python is among the topics covered in the 365 Program.
Learn More
Open, Close, Read, Write and Append to Files in Python
The following notebook template guides you through the process of creating a file and writing information in it using Python code. You will also learn how to append to a file and read the information from it. Some other related topics you might be interested in are Using Counter - a dictionary subclass in Python, String formatting in Python, and While Loops in Python. The Open, Close, Read, Write and Append to Files in Python template is among the topics covered in detail in the 365 Program.
Learn More
The Zip Function in Python
The following template is a comprehensive introduction to the zip function in Python and the way it is used. We discuss what happens when two or more lists are zipped. We also take a look at how this function can be used to unzip values and store them in separate variables. Some other related topics you might be interested in are The enumerate function in Python, Defining functions in Python - the Fibonacci sequence, and One-Dimensional Dictionaries in Python template. The Zip Function in Python is among the topics covered in the 365 Program.
Learn More
Using Counter - a Dictionary Subclass in Python
The following is a program that demonstrates the usage of the Counter subclass. It is used to determine the frequency of all characters in a string. This Counter object is then converted into a dictionary. Dictionary comprehension is then used to remove unnecessary characters from the dictionary. Some other related topics you might be interested in are While Loops in Python, Dictionary Comprehension in Python, and Bubble Sort in Python . The Using Counter - a Dictionary Subclass in Python is among the topics covered in detail in the 365 Data Science program.
Learn More
One-Dimensional Dictionaries in Python
The following template is a program implementing a dictionary in Python where the keys are a couple of countries. The values are their corresponding capitals. Within the notebook, it is demonstrated how to retrieve keys and values from the dictionary, how to create a new key: value pair and how to loop through the keys and the values using a for-loop. Some other related topics you might be interested in are While Loops in Python, Dictionary Comprehension in Python, and Using Counter - a Dictionary Subclass in Python. The One-Dimensional Dictionaries in Python template is among the topics covered in detail in the 365 Data Science program.
Learn More
While-Loops in Python
The following is a program demonstrating the implementation of a while-loop. The program asks the user to input the ages of students in a class. Using a while-loop, these ages are stored in an array and printed out in the end. Some other related topics you might be interested in are Linear Search in Python, Binary Search in Python, Insertion Sort in Python, and Sets and Operations with Sets in Python. The While-Loops in Python template is among the topics covered in detail in the 365 Data Science Program.
Learn More
Bubble Sort in Python
The following is a program which makes use of for-loops to implement the bubble sort algorithm in a function. Some other related topics you might be interested in are Linear search in Python, Binary search in Python, Insertion sort in Python, Sets and operations with sets in Python. The Bubble Sort in Python template is among the topics covered in detail in the 365 Data Science Program
Learn More
The If-Else Statement in Python
The following is a program demonstrating the implementation of the conditional if-else statement. The program asks the user to enter the temperature outside. It then gives recommendations on what actions the user needs to take. Some other related topics you might be interested in are True and False in Python, While-loops in Python, For-loops in Python. The If-Else Statement in Python template is among the topics covered in detail in the 365 Data Science Program.
Learn More
True and False in Python
The following notebook demonstrates the result of combining boolean expressions with the 'not', 'and', and 'or' logical operators. We first start simple by evaluating expressions containing two booleans and one logical operator. Then, we give and thoroughly explain a more intricate example containing several boolean expressions and operators. Some other related topics you might be interested in are The if-else statement in Python, While-loops in Python, and For-loops in Python. The True and False in Python template is among the topics covered in detail in the 365 Data Science program
Learn More
String Formatting in Python
In the following notebook template , you will find a series of examples that demonstrate the most important operations that one can perform on strings. From finding the length of a string all the way to creating a string storing a small poem and splitting it into separate words using the split() and strip() method. Some other related topics you might be interested in are User inputs in Python, Using Counter - a dictionary subclass in Python, Loops and if-statements, and Regular expressions in Python. The String Formatting in Python template is among the topics covered in detail in the 365 Data Science program
Learn More
User Inputs in Python
The following template is a program which demonstrates how to ask the user for an input and store that input either as a string, or as an integer, depending on the needs. Some other related topics you might be interested in are String formatting in Python, The if-else statement in Python, While-loops in Python, For-loops in Python. The User Inputs in Python template is among the topics covered in detail in the 365 Data Science program.
Learn More
Backpropagation Algorithm
The backpropagation algorithm is the fundamental building block of neural networks and is used to effectively train them through the chain rule method- a technique used to find the derivatives of cost, considering any variable in a nested equation. While most packages already contain backpropagation algorithms in them, knowing the math behind them and how they work will help you better understand more advanced algorithms as well as handle vanilla ones with ease. Check out these free short pdf course notes on the backpropagation algorithm to learn some of the useful formulas and finding the results for backpropagation for the output layer and hidden layer.
Learn More
Getting the Current Time in Python
This is a template demonstrating how to estimate the local time in the current time zone. It shows the application of the .now() method. Some other related topics you might be interested in are Converting Strings into Datetime Objects in Python, Replacing the Values of Datetime Objects in Python, Getting the Date of the Week in Python and Working with Format Codes in Python. The Getting the Current Time in Python template is among the topics covered in detail in the 365 Data Science program.
Learn More
Converting Strings into Datetime Objects in Python
This is a template demonstrating how to convert string values into datetime objects and display these values in a user-friendly form in Python. It includes the application of the .strptime() method from the datetime module. Some other related topics you might be interested in are Timestamps in Python, Converting Datetime Objects into Strings in Python, Replacing the Values of Datetime Objects in Python, and Working with Format Codes in Python. The Converting Strings into Datetime Objects in Python template is among the topics covered in detail in the 365 Data Science program.
Learn More
Working with Format Codes in Python
This template shows how to use the format codes. It demonstrates the combination of the Python .strftime() method and the format codes for indicating separate date and time elements. Other related topics you might be interested in are Timestamps in Python, Converting Datetime Objects into Strings in Python, Replacing the Values of Datetime Objects in Python, and Displaying Time Elements in Python. The Working with Format Codes in Python template is among the topics covered in detail in the 365 Data Science program.
Learn More
Timestamps in Python
This is a template demonstrating how to work with both date and time values in the form of a timestamp. Other related topics you might be interested in are Attributes of the Python Time class , Datetime Values in Python, Attributes of the Python Time Class, Working with Dates and Times Simultaneously and Converting Strings into Datetime Objects in Python. The Timestamps in Python template is among the topics covered in detail in the 365 Data Science program.
Learn More
Converting Datetime Objects into Strings in Python
This template shows how to convert datetime objects into strings. It demonstrates the application of the Python .strftime() method in a combination with the format codes. Other related topics you might be interested are Importing the Datetime Module in Python, Datetime Values in Python, Attributes of the Python Time Class, Estimating the Difference between Two Dates - timedelta Python, and Converting Strings into Datetime Objects in Python. The Converting Datetime Objects into Strings in Python template is among the topics covered in detail in the 365 Data Science program.
Learn More
Replacing the Values of Datetime Objects in Python
This template shows how to replace separate elements in a datetime object. It demonstrates the application of the .replace() method. Other related topics you might be interested in are Displaying Dates in Python, Datetime Values in Python, Getting the Date of the Week in Python, Displaying Time Elements in Python, Attributes of the Python Time Class, and Estimating the Difference between Two Dates - timedelta Python. The Replacing the Values of Datetime Objects in Python template is among the topics covered in detail in the 365 Data Science program.
Learn More
Working with Dates and Times Simultaneously in Python
This template shows how to use the 'datetime' class and manipulate date and time values simultaneously. Other related topics you might be interested in are Datetime Values in Python, Displaying Dates in Python, Displaying Dates in Python, Displaying Time in Python, Attributes of the Python Time Class, and Estimating the Difference between Two Dates - timedelta Python. The Working with Dates and Times Simultaneously in Python template is among the topics covered in detail in the 365 Data Science program.
Learn More
Neural Networks Overview
Currently, the closest technology to mimicking the human brain and learning process is deep learning. It uses mathematical functions to map the input to the output and form patterns out of the data. Computationally superior to machine learning, deep learning can even analyze huge sets of unstructured data. At the heart of deep learning are neural networks which mimic the neuron activity in the human brain, enabling us to learn the structure of data by performing various tasks, without the need for human intervention. Check out these short free pdf course notes to find out the three layers of deep neural networks and the activation functions.
Learn More
Displaying Time Elements in Python
This is a template that shows how can we display single elements from a time value using a function. Single elements can be microseconds, seconds, minutes, and hours. Other related topics you might be interested in are Datetime Values in Python, Displaying Dates in Python, Attributes of the Python Date Class, Displaying Time in Python, and Attributes of the Python Time Class. The Displaying Time Elements in Python template is among the topics covered in detail in the 365 Data Science program.
Learn More
Attributes of the Python Time Class
This is a template demonstrating the application of the 'time' class. It shows how to display time values with the attributes of the class and how to display time in a user-friendly form. Other related topics you might be interested in are Datetime Values in Python, Displaying Dates in Python, Attributes of the Python Date Class, Displaying Dates in Python and Estimating the Difference between Two Dates - timedelta Python. The Attributes of the Python Time Class template is among the topics covered in detail in the 365 Data Science program.
Learn More
Displaying Time in Python
This is a template demonstrating the implementation of the 'time' class and the way time values can be displayed like on a real clock. The 'time' class is part of the datetime module. Other related topics you might be interested in are Datetime Values in Python, Displaying Dates in Python, Attributes of the Python Date Class, Displaying Dates in Python and Estimating the Difference between Two Dates - timedelta Python. The Displaying Time in Python template is among the topics covered in detail in the 365 Data Science program.
Learn More
Getting the Date of the Week in Python
This is a template demonstrating how we can estimate the day of the week with the help of the .weekday() function - part of the date class from the datetime module. The function returns an integer corresponding to the day of the week. Other related topics you might be interested in are Datetime Values in Python, Displaying Dates in Python, Attributes of the Python Date Class, Displaying Time in Python. The Getting the Date of the Week in Python template is among the topics covered in detail in the 365 Data Science program.
Learn More
Estimating the Difference between Two Dates - timedelta Python
This is a template demonstrating how we can estimate the duration between two dates in Python. It introduces the use of the class 'timedelta'. Other related topics you might be interested in are Datetime Values in Python, Displaying Dates in Python, Displaying Dates in Python, Attributes of the Python Date Class. The Estimating the Difference between Two Dates template is among the topics covered in detail in the 365 Data Science program.
Learn More
Attributes of the Python Date Class
The Attributes of the Python Date Class demonstrates the use of the attributes of the date class from the datetime module. It shows how to display the separate date elements. Other related topics you might be interested in are Datetime Values in Python, Displaying Dates in Python, Displaying Dates in Python, Displaying Time in Python. The Attributes of the Python Date Class template is among the topics covered in detail in the 365 Data Science program.
Learn More
Intro to Neural Networks
Machine Learning is the field concerned with building computational models that can execute high-level tasks using human-like reasoning. In other words, machine learning models possess the ability to learn autonomously. The recent introduction of neural networks has opened a new set of possibilities for machine learning and deep learning. Before you explore them, check out these free pdf course notes on intro to neural networks and get to know the building blocks of a machine learning algorithm, and the two types of supervised learning- regression and classification.
Learn More
Displaying Dates in Python
This is a template demonstrating how to convert values into datetimes and display these values in a user-friendly form. It includes the application of the .strptime() method from the datetime module. Other related topics you might be interested in are Datetime Values in Python, Displaying Dates in Python, Displaying Dates in Python, Displaying Time in Python.The Displaying Dates in Python template is among the topics covered in detail in the 365 Data Science program.
Learn More
Importing the Datetime Module in Python
This template demonstrates the technique of importing the Python datetime module and its separate classes for working with dates and times. Other related topics you might be interested in are Datetime Values in Python, Displaying Dates in Python, Displaying Dates in Python, Displaying Time in Python. The Importing the Datetime Module in Python template is among the topics covered in detail in the 365 Data Science program.
Learn More
Probability
We use the intuitive concept of probability on a daily basis in our lives, just by the mere fact that we live in constant uncertainty. Data Science is one of the fields where we need to have conscious mastery and understanding of probability – the backbone of many important data science concepts. If you want to adopt the probabilistic mindset then check out our free pdf course notes which will teach you the basics of probability, combinatorics, Bayesian Notation, discrete distributions, continuous distributions, setting up and solving integrals and expressing complex formulas in Wolfram Alpha.
Learn More
Bar and Line Chart with Matplotlib in Python
This template shows a combination chart, showing the frequency of Python users among participants from a KDNuggets annual survey across several consecutive years, represented with a bar and line chart in Python's matplotlib library. Some other related topics you might be interested in are Bar chart in matplotlib Python, Line chart in matplotlib Python, Regression scatter plot with seaborn matplotlib in Python, Regression Scatter Plot with seaborn regplot in Python. The Bar and Line Chart with Matplotlib in Python template is among the topics covered in detail in the 365 Data Science program.
Learn More
Model Accuracy in Python
In this template, we classify points using the logistic regression method provided by statsmodels. Afterwards, we create a confusion matrix that makes it easier to see the correctly and incorrectly classified classes. Some other related topics you might be interested in are Logistic Regression with statsmodels in Python, Confusion Matrix with statsmodels in Python, Logistic Regression Curve in Python. The Model Accuracy in Python template is among the topics covered in detail in the 365 Data Science program.
Learn More
Logistic Regression Curve in Python
In this template, we demonstrate how to create a logistic regression using statsmodels. Then, we plot the resulting regression curve onto the data points to visualize the result. Some other related topics you might be interested in are Logistic Regression with statsmodels in Python, Confusion Matrix with Statsmodels in Python, Model Accuracy in Python. You can now download the Python template for free. The Logistic Regression Curve in Python template is among the topics covered in detail in the 365 Data Science program.
Learn More
Downloading Files with Requests in Python
The following template shows how one can download large files to their computer through Python without wasting too many resources. This is done with the help of only one library - requests. Some other related topics you might be interested in are Searching for Тags with BeautifulSoup - find and find_all in Python, Extracting All Links from a Webpage Using BeautifulSoup in Python and Extracting Tables from a Webpage with Pandas in Python. You can now download the Python template for free. The Downloading Files with Requests in Python template is among the topics covered in detail in the 365 Data Science program.
Learn More
Python for Finance
Python is a high-level multipurpose programming language that is popular among all levels of programmers/data practitioners working in the field of education, big tech, transportation, science, agriculture and last but not least- finance. The plethora of Python libraries, its intuitive syntax, and wide range of tools allow Python to provide data-driven solutions to financial institutions of all sizes. In these free pdf course notes, we will explore the power of Python for finance, covering tools and techniques used by financial professionals such as calculating and comparing rates of return in Python, measuring investment risk, performing regression analyses, using Monte Carlo simulations as decision-making tools and much more.
Learn More
Intro to Python
Python is the top programming language in both the TIOBE and PYPL Index, making it one of the most popular programming languages worldwide. This is all thanks to its intuitive, beginner-friendly syntax and wide range of real-world applications like web development, scientific computing, game development, AI & machine learning, graphic design etc. But before you can dwell in this vast world of possibilities, you need to learn the basics of Python. We introduce you the free pdf Intro to Python course notes where you will learn basic Python syntax, how to create and use functions, conditional statements , iteration and much more.
Learn More
Extracting Tables from a Webpage with Pandas in Python
This is a template exploring how one can extract the contents of tables on websites straight to a Pandas data frame. This is done through Pandas itself, so there are no additional libraries required. Some other related topics you might be interested in are, Incorporating Commonly Used HTML Tags in Python, Searching by Attributes with Beautiful Soup in Python is, Extracting HTML attributes using BeautifulSoup in Python and Setting up Beautiful Soup and Choosing a Parser in Python. You can now download the Python template for free. The Extracting Tables from a Webpage with Pandas in Python template is among the topics covered in detail in the 365 Data Science program.
Learn More
Extracting All Links from a Webpage Using Beautiful Soup in Python
This is a template demonstrating how one can extract the attributes from an HTML tag using BeautifulSoup. HTML attributes are a tool to specify additional information regarding the tag and/or change its behavior. Some other related topics you might be interested in are, Incorporating Commonly Used HTML Tags in Python, Searching by Attributes with Beautiful Soup in Python is and Setting up Beautiful Soup and Choosing a Parser in Python. You can now download the Python template for free. The Extracting All Links from a Webpage Using Beautiful Soup in Python template is among the topics covered in detail in the 365 Data Science program.
Learn More
Navigating the HTML Using Beautiful Soup in Python Template
This is a template demonstrating different Beautiful Soup methods for navigating the HTML tree. There are multiple ways to achieve this - finding the contents of a tag, its children, or its parent. Some other related topics you might be interested in are Incorporating URL Parameters into a GET Request, Sending a GET request in Python, Commonly Used HTML Tags in Python, Searching by Attributes with Beautiful Soup in Python is and Setting up Beautiful Soup and Choosing a Parser in Python. You can now download the Python template for free. The Navigating the HTML using Beautiful Soup in Python template is among the topics covered in detail in the 365 Data Science program.
Learn More
Searching by Attributes with Beautiful Soup in Python Template
The Searching by Attributes with Beautiful Soup in Python is a template that shows how we can incorporate attributes in our search for tags using the 'find' and 'find_all' methods of Beautiful Soup. Some other related topics you might be interested in are Incorporating URL Parameters into a GET Request, Sending a GET request in Python, Commonly Used HTML Tags in Python, and Setting up Beautiful Soup and Choosing a Parser in Python. You can now download the Python template for free. The Searching by Attributes with Beautiful Soup in Python template is among the topics covered in detail in the 365 Data Science program.
Learn More
Searching for Тags with Beautiful Soup - find and find all in Python Template
This is a template that shows how we can use the 'find' and 'find_all' methods of Beautiful Soup to search for tags in the HTML document. It also demonstrates what happens if no tag is found. Some other related topics you might be interested in are Incorporating URL Parameters into a GET Request, Sending a GET request in Python, Commonly Used HTML Tags in Python, and Setting up Beautiful Soup and Choosing a Parser in Python. You can now download the Python template for free. The Searching for Тags with Beautiful Soup - find and find all in Python template is among the topics covered in detail in the 365 Data Science program.
Learn More
Setting up Beautiful Soup and Choosing a Parser in Python Template
The Setting up Beautiful Soup and Choosing a Parser in Python Template shows the first steps needed to be taken when starting to scrape with Beautiful Soup - connecting to the website, checking out the html, creating the soup and choosing a Parser, and finally, exporting the html to a file. Some other related topics you might be interested in are Incorporating URL Parameters into a GET Request, Sending a GET request in Python, Commonly Used HTML Tags in Python. You can now download the Python template for free. The Setting up Beautiful Soup and Choosing a Parser in Python template is among the topics covered in detail in the 365 Data Science program.
Learn More
Reading from and Writing to Files in Python Template
The Reading from and Writing to Files in Python Template demonstrates how one can read and write files in Python. It also introduces the 'with' statement through which we can automatically close the file after we finish working with it. Some other related topics you might be interested in are Incorporating URL Parameters into a GET Request, Sending a GET request in Python, Commonly Used HTML Tags in Python. You can now download the Python template for free. The Reading from and Writing to Files in Python template is among the topics covered in detail in the 365 Data Science program.
Learn More
Request Headers and Emulating a Browser in Python Template
In the Request Headers and Emulating a Browser in Python template we explore how to define different request headers and also manipulate the 'User-Agent' string in order to pretend that the request was sent through a browser. Some other related topics you might be interested in are Incorporating URL Parameters into a GET Request, Sending a GET request in Python, Reading from and Writing to Files in Python. You can now download the Python template for free. The Request Headers and Emulating a Browser in Python template is among the topics covered in detail in the 365 Data Science program.
Learn More
R-squared and Adjusted R-squared with sklearn in Python Template
The R-squared and Adjusted R-squared with sklearn in Python demonstrates how to return the R-squared and R-squared values of a model when performing linear regression. Some other related topics you might be interested in are Regression Summary Table with sklearn in Python, Feature Selection through p-values with sklearn in Python, Feature Selection through Standardization with sklearn in Python. You can now download the Python template for free. The R-squared and Adjusted R-squared with sklearn in Python template is among the topics covered in detail in the 365 Data Science program.
Learn More
Visualizing Linear Regressions with Matplotlib in Python Template
The Visualizing Linear Regressions with Matplotlib in Python template demonstrates how to plot the regression line of a linear regression model onto the data. We go through the steps of loading the data from a .csv file, then mapping dummy variables onto numerical values, performing a linear regression using statsmodels and, finally, visualize what we have created. Some other related topics you might be interested in are Regression Summary Table with statsmodels in Python, Predictions with statsmodels in Python, Linear Regression Model in Python - predictions versus targets. eeee You can now download the Python template for free. The Visualizing Linear Regressions with Matplotlib in Python template is among the topics covered in detail in the 365 Data Science program.
Learn More
Heatmaps and Dendrograms with seaborn in Python Template
The Heatmaps and Dendrograms with seaborn in Python template demonstrates how to create heatmaps and dendrograms using the seaborn package in Python.Some other related topics you might be interested in are K-Means Clustering of Numerical Data with sklearn in Python, The Elbow Method for K-Means Clustering in Python, K-Means Clustering of Categorical Data with sklearn in Python. You can now download the Python template for free. The Heatmaps and Dendrograms with seaborn in Python template is among the topics covered in detail in the 365 Data Science program.
Learn More
Statistics
Before we can build machine learning algorithms or extract valuable insight from our data we need to transform the raw data into an understandable format and check its quality. In other words, we need to do data preprocessing, which requires statistical knowledge every step along the way. Therefore, learning statistics is a must-have skill when doing data science. In these free pdf course notes, we will be covering the fundamentals of statistics, the different types of distributions, confidence intervals and respective formulas, calculation of covariance and correlation, hypotheses testing, and much more
Learn More
Machine Learning with Ridge and Lasso Regression
One of the most common problems every data scientist faces when training machine learning models is overfitting—overcomplicating the model with irrelevant data, thereby reducing the model’s predictive and classification capabilities. This is where the regularization techniques -ridge and lasso come to the rescue, as they simplify the model and remove all the data noise. In these free pdf course notes, we will cover the basic concepts behind regression analyses, ridge vs lasso regression, cross validation for choosing a tuning parameter and relevant metrics for evaluating the model’s performance.
Learn More
The Elbow Method for K-Means Clustering in Python Template
The Elbow Method for K-Means Clustering in Python template demonstrates a way to determine the most optimal value of K in a K-Means clustering problem. Recall that K represents the numbers of clusters. The way this is done is through the so-called elbow method which requires calculating the within-cluster sum of squares for each number of clusters.. Some other related topics you might be interested in are K-Means Clustering of Numerical Data with sklearn in Python, Heatmaps and Dendrograms with seaborn in Python, K-Means Clustering of Categorical Data with sklearn in Python. You can now download the Python template for free. The Elbow Method for K-Means Clustering in Python template is among the topics covered in detail in the 365 Data Science program.
Learn More
K-Means Clustering of Numerical Data with sklearn in Python Template
The K-Means Clustering of Numerical Data with sklearn in Python template shows how to solve a simple clustering problem using the K-Means algorithm provided by the sklearn machine learning package. After performing the clustering, we will visualize the results and identify the clusters. Some other related topics you might be interested in are The Elbow Method for K-Means Clustering in Python, Heatmaps and Dendrograms with seaborn in Python, K-Means Clustering of Categorical Data with sklearn in Python. You can now download the Python template for free. The K-Means Clustering of Numerical Data with sklearn in Python is among the topics covered in detail in the 365 Data Science program.
Learn More
Logistic Regression with statsmodels in Python Template
The Logistic Regression with statsmodels in Python template shows how to solve a simple classification problem using the logistic regression model provided by the statsmodels library. The database used for the example is read using the pandas library.. Some other related topics you might be interested in are Confusion Matrix with statsmodels in Python, Logistic Regression Curve in Python, Model Accuracy in Python. You can now download the Python template for free. The Logistic Regression with statsmodels in Python template is among the topics covered in detail in the 365 Data Science program.
Learn More
Confusion Matrix with statsmodels in Python Template
In this Confusion Matrix with statsmodels in Python template, we will show you how to solve a simple classification problem using the logistic regression algorithm. Then, we will create a python confusion matrix of the model using the statsmodels library and make the table more beautiful and readable with the help of the pandas library. Some other related topics you might be interested in are Logistic regression with statsmodels in Python, Logistic Regression Curve in Python, Model Accuracy in Python. You can now download the Python template for free. The Confusion Matrix with statsmodels in Python template is among the topics covered in detail in the 365 Data Science program.
Learn More
Linear Regression Model in Python - Predictions versus Targets Template
In this Linear Regression Model in Python- predictions versus targets template, we will show you how to plot the predictions the model has made versus the true targets. Some other related topics you might be interested in are Predictions with statsmodels in Python, Feature Selection through Standardization with sklearn in Python, Predictions with standardized Coefficients with sklearn in Python, Visualizing Linear regressions with matplotlib in Python. You can now download the Python template for free. The Dummy Variables with pandas in Python template is among the topics covered in detail in the 365 Data Science program.
Learn More
Dummy Variables with pandas in Python Template
When preparing data for a machine learning algorithm, very often we see variables that do not bear numerical values The Dummy Variables with pandas in Python template demonstrates how to map categorical data onto numerical values using the pandas library. Some other related topics you might be interested in are Mapping Categorical to Numerical Data with pandas in Python, Removing Missing Values with pandas in Python, Removing Outliers with pandas in Python. You can now download the Python template for free. The Dummy Variables with pandas in Python template is among the topics covered in detail in the 365 Data Science program.
Learn More
The OLS Assumptions in Python – No Multicollinearity
The OLS Assumptions in Python – No Multicollinearity shows how to detect possible collinearity between several data set features and deal with them. In this example, we investigate the possible collinearity between several car features and remove the unnecessary ones. Some other topics you might be interested in exploring are OLS Assumptions in Python - No Multicollinearity, Linear Regression Model in Python – Residuals. You can now download the Python template for free. The OLS Assumptions in Python - No Multicollinearity template is among the topics covered in detail in the 365 Data Science program.
Learn More
OLS Assumptions in Python - Linearity Template
The OLS Assumptions in Python - Linearity shows how to transform non-linear dependencies into linear. In this example, we check the dependencies between the price of a car with respect to the year of manufacturing, its price and its mileage. Some other related topics you might be interested are OLS assumptions in Python – Linearity and Linear regression model in Python - residuals. You can now download the Python template for free. The OLS Assumptions in Python - Linearity template is among the topics covered in detail in the 365 Data Science program.
Learn More
Data-Driven Business Growth
Becoming a data-driven organization requires much more than investments in data science and machine learning. A company can have as many data professionals and data resources available and still fail in leveraging them to reach organizational objectives. This is where data maturity comes into play, as it provides a framework for companies-small and big to build the necessary data-driven infrastructure. In these Data-driven Business Growth course notes we are going to cover the importance of the growth mindset , cover the 3 stages of data maturity, how to pass each stage.
Learn More
Removing Outliers with pandas in Python Template
The Removing Outliers with pandas in Python shows how to detect and remove samples that skew a dataset and might lead to building an inaccurate model. Some other related topics you might be interested are Removing Outliers with pandas in Python, Dummy Variables with pandas in Python, Feature Selection through p-values with sklearn in Python, Feature Selection through standardization with sklearn in Python, Linear Regression Model in Python – residuals. You can now download the Python template for free. The Removing Outliers with pandas in Python template is among the topics covered in detail in the 365 Data Science program.
Learn More
Removing Missing Values with pandas in Python Template
The Removing Missing Values with pandas in Python shows how to detect and remove samples from a dataset that contain missing values. Some other related topics you might be interested are Removing Outliers with pandas in Python, Dummy Variables with pandas in Python, Feature Selection through p-values with sklearn in Python, Feature Selection through standardization with sklearn in Python, Linear Regression Model in Python – residuals. You can now download the Python template for free. The Removing Missing Values with pandas in Python template is among the topics covered in detail in the 365 Data Science program.
Learn More
Train and Test Split with sklearn in Python Template
The Train and Test Split with sklearn in Python template shows how to prevent overtraining of the machine learning algorithm by using the convenient train_test_split() method provided by sklearn to split a database into two parts - a training and a testing dataset. Some other related topics you might be interested are Regression Summary Table with sklearn in Python, Feature Selection through p-values with sklearn in Python, Feature Selection through Standardization with sklearn in Python, Predictions with Standardized Coefficients with sklearn in Python. You can now download the Python template for free. The Train and Test Split with sklearn in Python template is among the topics covered in detail in the 365 Data Science program.
Learn More
Predictions with Standardized Coefficients with sklearn in Python Template
The Predictions with Standardized Coefficients with sklearn in Python shows how to predict values using a model that was fit on standardized inputs. First, we solve a multiple linear regression problem with two continuous features using the machine learning package sklearn, after which we apply standardization. Some other related topics you might be interested are Predictions with statsmodels in Python, Feature Selection through Standardization with sklearn in Python, Visualizing Linear Regressions with matplotlib in Python. You can now download the Python template for free. The Predictions with Standardized Coefficients with sklearn in Python template is among the topics covered in detail in the 365 Data Science program.
Learn More
Correlation in Excel Template
The Correlation in Excel template demonstrates how the correlation coefficient can be calculated in Excel. Some other related topics you might be interested in are Calculating the Variance in Excel, Standard Deviation in Excel, Coefficient of Variation in Excel, Covariance in Excel. You can now download the Excel template for free. The Correlation in Excel template is among the topics covered in detail in the 365 Data Science program.
Learn More
Covariance in Excel Template
The Covariance in Excel template demonstrates how the covariance metric can be calculated in Excel. Some other related topics you might be interested in are Calculating the Variance in Excel, Standard Deviation in Excel, Coefficient of Variation in Excel, Correlation in Excel You can now download the Excel template for free. The Covariance in Excel template is among the topics covered in detail in the 365 Data Science program.
Learn More
Standard Deviation in Excel Template
The following Standard Deviation in Excel template introduces the relevant Excel syntax for calculating sample standard deviation. Some other related topics you might be interested in are Calculating the variance in Excel, Coefficient of Variation in Excel, Covariance in Excel, Correlation in Excel You can now download the Excel template for free. Standard Deviation in Excel template is among the topics covered in detail in the 365 Data Science program.
Learn More
Calculating the Variance in Excel Template
The following Calculating the Variance in Excel template demonstrates the difference between sample variance and population variance. It introduces the relevant Excel syntax for calculating these 2 metrics. Some other related topics you might be interested in are Standard Deviation in Excel, Coefficient of Variation in Excel, Covariance in Excel, Correlation in Excel. You can now download the Excel template for free. Calculating the Variance in Excel template is among the topics covered in detail in the 365 Data Science program.
Learn More
Negative Skew in Excel Template
The following Negative Skew in Excel template includes a sample dataset resulting in a negatively (left) skewed frequency distribution graph. Some other related topics you might be interested in are Positive Skew in Excel, Zero Skew in Excel, Normal Distribution in Excel, Standard Normal Distribution in Excel. You can now download the Excel template for free. Negative Skew in Excel template is among the topics covered in detail in the 365 Data Science program.
Learn More
Zero Skew in Excel Template
The following Zero Skew in Excel template includes a sample dataset resulting in a zero skewed (no skew) frequency distribution graph Some other related topics you might be interested in are Positive Skew in Excel, Negative Skew in Excel, Normal Distribution in Excel, Standard Normal Distribution in Excel. You can now download the Excel template for free. Zero Skew in Excel template is among the topics covered in detail in the 365 Data Science program.
Learn More
Positive Skew in Excel Template
The Positive Skew in Excel template includes a sample dataset resulting in a positively (right) skewed frequency distribution graph. Some other related topics you might be interested in are Zero Skew in Excel, Negative Skew in Excel, Normal Distribution in Excel, Standard Normal Distribution in Excel. You can now download the Excel template for free. Positive Skew in Excel template is among the topics covered in detail in the 365 Data Science program.
Learn More
Calculating the Mode in Excel Template
The Calculating the Mode in Excel template shows how to apply the Excel function corresponding to finding the mode of a set of numbers. Some other related topics you might be interested in are Calculating the Mean in Excel, Calculating the Median in Excel, Covariance in Excel, and Correlation in Excel. You can now download the Excel template for free. Calculating the Mode in Excel template is among the topics covered in detail in the 365 Data Science program.
Learn More
Calculating the Median in Excel Template
The Calculating the Median in Excel template shows how to apply the Excel function corresponding to finding the median of a set of numbers. Some other related topics you might be interested in are Calculating the Mean in Excel, Calculating the Mode in Excel, Covariance in Excel, and Correlation in Excel.
Learn More
Calculating the Mean in Excel Template
The Calculating the Mean in Excel template shows how to apply the Excel function corresponding to finding the mean of a set of numbers. Some other related topics you might be interested in are Pareto Diagram in Excel, Side-by-Side Bar Chart in Excel, Normal Distribution in Excel, Stacked Area Chart in matplotlib Python, Bar and Line chart in Excel You can now download the Excel template for free. Calculating the Mean in Excel template is among the topics covered in detail in the 365 Data Science program.
Learn More
Export Data as csv in R Template
The Export Data as csv in R template shows how to export a data set from R and save it as an csv file. The file in question contains an employee database. Some other related topics you might be interested in are Calculating Standard Deviation in R, Calculating Data Mean in R, Calculating Standard Deviation of Data in R, Exploring Data Skewness in R. You can now download the R template for free. Export Data as csv in R template is among the topics covered in detail in the 365 Data Science program.
Learn More
Adding a New Column to a Data Frame in R Template
The Adding a New Column to a Data Frame in R template shows how to create a dataframe in R and add additional columns to it. We create a Star Wars data frame containing movies and stats and include two additional columns to extend the dataframe. Some other related topics you might be interested are Adding a New Row to a Data Frame in R, Dealing with Missing Data in R, Read a csv File into R, Export Data as csv in R. You can now download the R template for free. Adding a New Column to a Data Frame in R template is among the topics covered in detail in the 365 Data Science program.
Learn More
Adding a New Row to a Data Frame in R Template
The Adding a New Row to a Data Frame in R template shows how to add a row in an R data frame. The file shows how to create a data frame object in R from scratch, containing information and stats about movies and then shows how to extend the data frame by adding new columns. Some other related topics you might be interested are Adding a New Column to a Data Frame in R, Dealing with Missing Data in R, Read a csv File into R, Export Data as csv in R. You can now download the R template for free. Adding a New Row to a Data Frame in R template is among the topics covered in detail in the 365 Data Science program.
Learn More
Read a csv File in R Template
The Read a csv File in R template shows how to import a csv file into R with the help of the read csv() function. The file in question contains a real estate data set detailing information on different properties. Some other related topics you might be interested are Scatter plot with ggplot2 in R, Regression Scatter with ggplot2 in R, and Correlation between Two Variables in R. You can now download the R template for free. The Read a csv File in R template is among the topics covered in detail in the 365 Data Science program.
Learn More
Linear Regression in R Template
The Linear Regression in R template shows how to perform a linear regression in R using lm() on real estate property data. Some other related topics you might be interested are Scatter plot with ggplot2 in R, Regression Scatter with ggplot2 in R, and Correlation between Two Variables in R. You can now download the R template for free. Linear Regression in R template is among the topics covered in detail in the 365 Data Science program.
Learn More
Correlation between Two Variables in R Template
The Correlation between Two Variables in R template shows how to calculate the correlation coefficient between two variables in a dataset with the help of the corr() function. Some other related topics you might be interested in checking are Calculating Data Variance in R, Calculating Data Mean in R, Calculating Standard Deviation of Data in R, and Exploring Data Skewness in R. You can now download the R template for free. Correlation between Two Variables in R is among the topics covered in detail in the 365 Data Science program.
Learn More
DELETE Statement in SQL
The DELETE Statement in SQL template shows you how to delete information from the table's columns. Download and unzip the .zip file in a new folder. Inside the folder you will find a .sql file. Load it into MySQL Workbench. Some other related topics you might be interested are Creating a Database, ORDER BY Clause, SELECT Statement, and INSERT Statement. You can now download the SQL template for free. DELETE Statement in SQL is among the topics covered in detail in the 365 Data Science program.
Learn More
INSERT Statement in SQL Template
The INSERT Statement in SQL template shows you how to add information into the table's columns. Download and unzip the .zip file in a new folder. Inside the folder you will find a .sql file. Load it into MySQL Workbench. Some other related topics you might be interested are Creating a Database, ORDER BY Clause, SELECT Statement, and DELETE Statement. You can now download the SQL template for free. INSERT Statement in SQL is among the topics covered in detail in the 365 Data Science program.
Learn More
SELECT Statement in SQL Template
The SELECT Statement in SQL template shows you how to extract a fraction of the entire dataset. Download and unzip the .zip file in a new folder. Inside the folder you will find a .sql file. Load it into MySQL Workbench. Some other related topics you might be interested are Creating a Database, ORDER BY Clause, INSERT Statement, and DELETE Statement. You can now download the SQL template for free. SELECT Statement in SQL is among the topics covered in detail in the 365 Data Science program.
Learn More
Subqueries with EXISTS in SQL Template
The Subqueries with EXISTS in SQL template shows how EXISTS is nested inside WHERE to obtain particular records. Download and unzip the .zip file in a new folder. Inside the folder you will find a .sql file. Load it into MySQL Workbench. Some other related topics you might be interested are Creating a Database, ORDER BY Clause, SELECT Statement. You can now download the SQL template for free. Subqueries with EXISTS in SQL is among the topics covered in detail in the 365 Data Science program.
Learn More
MIN() Function in SQL Template
The MIN() Function in SQL template shows how this aggregate function performs a calculation on a set of values. The MIN() function returns the minimum value of a column. Download and unzip the .zip file in a new folder. Inside the folder you will find a .sql file. Load it into MySQL Workbench. Some other related topics you might be interested are Creating a Database, MAX() Function, AVG() Function, SUM() Function, COUNT() Function. You can now download the SQL template for free. MIN() Function in SQL is among the topics covered in detail in the 365 Data Science program.
Learn More
ALTER TABLE Statement in SQL Template
The ALTER TABLE Statement in SQL template explains the process of using a database in SQL. Download and unzip the .zip file in a new folder. Inside the folder you will find a .sql file. Load it into MySQL Workbench. Some other related topics you might be interested are Creating a Database, ORDER BY Clause, SELECT Statement, and INSERT Statement. You can now download the SQL template for free. ALTER TABLE Statement in SQL is among the topics covered in detail in the 365 Data Science program.
Learn More
Using a Database in SQL Template
The Using a Database in SQL template explains the process of using a database in SQL. Download and unzip the .zip file in a new folder. Inside the folder you will find a .sql file. Load it into MySQL Workbench. Some other related topics you might be interested are Creating a Database, ORDER BY Clause, SELECT Statement, and INSERT STATEMENT. You can now download the SQL template for free. Using a Database in SQL is among the topics covered in detail in the 365 Data Science program.
Learn More
GROUP BY Clause in SQL Template
The GROUP BY Clause in SQL template shows how to group the data based on the same value in a specific column. Download and unzip the .zip file in a new folder. Inside the folder you will find a .sql file. Load it into MySQL Workbench. Some other related topics you might be interested are Creating a Database, ORDER BY Clause, SELECT Statement You can now download the SQL template for free. GROUP BY Clause in SQL is among the topics covered in detail in the 365 Data Science program.
Learn More
ORDER BY Clause in SQL Template
This ORDER BY in SQL template specifies that a SQL SELECT statement returns a result set with the rows being sorted by the values of one or more columns. Download and unzip the .zip file in a new folder. Inside the folder you will find a .sql file. Load it into MySQL Workbench. Some other related topics you might be interested are Creating a Database in SQL, GROUP BY Clause in SQL, SELECT Statement in SQL. You can now download the SQL template for free. ORDER BY Clause in SQL is among the topics covered in detail in the 365 Data Science program.
Learn More
AVG() Function in SQL Template
The AVG() Function in SQL template shows how to extract the average of all non-null values in a field.The MAX() function. Download and unzip the .zip file in a new folder. Inside the folder you will find a .sql file. Load it into MySQL Workbench. Some other related topics you might be interested are Creating a Database, COUNT() Function, MIN() Function, and MAX() Function. You can now download the SQL template for free. AVG() Function in SQL is among the topics covered in detail in the 365 Data Science program.
Learn More
MAX() Function in SQL Template
The MAX() Function in SQL template is part of the aggregate functions which perform calculation on multiple values and return single values. The MAX() function, in particular, returns the maximum value of a column. Download and unzip the .zip file in a new folder. Inside the folder you will find a .sql file. Load it into MySQL Workbench. Some other related topics you might be interested are Creating a Database, COUNT() Function, MIN() Function, and AVG() Function. You can now download the SQL template for free. MAX() Function in SQL is among the topics covered in detail in the 365 Data Science program.
Learn More
SUM() Function in SQL Template
The SUM() Function in SQL template is part of the aggregate functions which perform a calculation on a set of values - they gather data from many rows of a table, then aggregate it into a single value. The SUM() function returns the sum of the values in a specified column. Download and unzip the .zip file in a new folder. Inside the folder you will find a .sql file. Load it into MySQL Workbench. Some other related topics you might be interested are Creating a Database, COUNT() Function, MIN() Function, MAX() Function, AVG() Function You can now download the SQL template for free. SUM() Function in SQL is among the topics covered in detail in the 365 Data Science program.
Learn More
COUNT() Function in SQL Template
The COUNT() Function in SQL template shows you how to perform a calculation on a set of values - gather data from many rows of a table, then aggregate it into a single value. The COUNT() function returns the number of rows that matches a particular criterion. Download and unzip the .zip file in a new folder. Inside the folder you will find a .sql file. Load it into MySQL Workbench. Some other related topics you might be interested are Creating a Database, SUM() Function, MIN() Function, MAX() Function, and AVG() Function. You can now download the SQL template for free. COUNT() Function in SQL is among the topics covered in detail in the 365 Data Science program.
Learn More
How to Become a Research Analyst
The research analyst is an entry-level position that is responsible for helping a company coordinate its research related activities and investigate special requests. They serve as task leads across the departments within a company, coordinating between stakeholders, project teams, master data teams and team leaders. The dynamic and responsible nature of the job gives the necessary experience for individuals to grow into future analytics managers and data scientists. Therefore, in this free pdf infographic on How to Become a Research Analyst, we are going to describe the research analyst profile, job responsibilities, average salary numbers, required skills and more, so you can start on the right foot.
Learn More
Starting a Career in Data Science
The data science career path has become increasingly competitive over the years, as the supply of data scientists is slowly outpacing the demand. Landing a data scientist job now is harder than 5 years ago, and employers have become more selective in the recruiting process. Businesses are looking for competent data scientists with solid preparation. Therefore, in these free pdf course notes you will be taught how to create a professional data science project portfolio, build a job-landing resume, ace the data science interview questions, solve the take-home test and ultimately start a career in data science.
Learn More
How to Become a Marketing Analyst
The overall goal of a marketing analyst is to discover and present marketing insights by working with the company’s pool of data to increase marketing and sales performance Therefore, the marketing analyst job is a highly dynamic role that requires a combination of strong communication, analytical and marketing skills. If you want to go into greater detail on what is a marketing analyst, what does a marketing analyst do, what are the required marketing analyst skills and what is the marketing analyst career path then check out the free pdf infographic on How to Become a Marketing Analyst.
Learn More
Excel Functions
The majority of data comes in spreadsheet format, making Excel the #1 tool of choice for professional data analysts. The ability to work effectively and efficiently in Excel is highly desirable for any data practitioner who is looking to bring value to a company. As a matter of fact, being proficient in Excel has become the new standard, as 82% of middle-skill jobs require competent use of the productivity software. Take this free Excel Functions practice exam and test your knowledge on removing duplicate values, transferring data from one sheet to another, rand using the VLOOKUP and SUMIF function.
Learn More
Useful Tools in Excel
What Excel lacks in data visualization tools compared to Tableau, or computational power for analyzing big data compared to Python, it compensates with accessibility and flexibility. Excel allows you to quickly organize, visualize and perform mathematical functions on a set of data, without the need for any programming or statistical skills. Therefore, it is in your best interest to learn how to use the various Excel tools at your disposal. This practice exam is a good opportunity to test your excel knowledge in the text to column functions, excel macros, row manipulation and basic math formulas.
Learn More
Excel Basics
Ever since its first release in 1985, Excel continues to be the most popular spreadsheet application to this day- with approximately 750 million users worldwide, thanks to its flexibility and ease of use. No matter if you are a data scientist or not, knowing how to use Excel will greatly improve and optimize your workflow. Therefore, in this free Excel Basics practice exam you are going to work with a dataset of a company in the Fast Moving Consumer Goods Sector as an aspiring data analyst and test your knowledge on basic Excel functions and shortcuts.
Learn More
Feature Selection Through Standardization with sklearn in Python Template
The following Feature Selection Through Standardization with sklearn in Python template shows how to solve a multiple linear regression problem with two continuous features. These features are standardized using a StandardScaler() object. After fitting the model to the scaled data, we construct a summary table in the form of a dataframe. It stores the features as well as their biases and weights (the machine learning jargon for intercepts and coefficients). The irrelevant features are automatically penalized by a small magnitude of the weight. Such a procedure is known as feature scaling through standardization. Open the .ipynb file using Jupyter notebook. Another related topics is Feature selection through p-values with sklearn in Python. You can now download the Python template for free. Feature Selection Through Standardization with sklearn in Python is among the topics covered in detail in the 365 Data Science program.
Learn More
Regression Summary Table with sklearn in Python Template
The following Regression Summary Table with sklearn in Python template shows how to solve a multiple linear regression problem using the machine learning package sklearn. We create a summary table in the form of a dataframe which stores the features of the model, the corresponding coefficients and their p-values. Open the .ipynb file using Jupyter notebook. Some other related topics are Regression summary table with statsmodels Python, R-squared and Adjusted R-squared with sklearn Python. You can now download the Python template for free. Regression Summary Table with sklearn in Python is among the topics covered in detail in the 365 Data Science program.
Learn More
Feature Selection Through p-values with sklearn in Python Template
The following Feature Selection Through p-values with sklearn in Python template shows how to solve a multiple linear regression problem using the machine learning package sklearn. Based on the p-value of each feature, we can determine whether it is useful or irrelevant. Download and unzip the .zip file in a new folder. Inside the folder you will find a .csv and a .ipynb file. The first one contains the database and the second one contains the Python code. Open the .ipynb file using Jupyter notebook. Some other related topics are Feature selection through standardization with sklearn in Python.
Learn More
A/B Testing for Social Media
In this free A/B Testing for Social Media practice exam, you are an experienced data analyst who works at a new social media company called FilmIt. You are tasked with the job of increasing user engagement by applying the correct modifications to how users move on to the next video. You decide that the best approach is by conducting a A/B test in a controlled environment. Therefore, in order to successfully complete this task, you are going to be tested on statistical significance, 2 tailed-tests and choosing the success metrics.
Learn More
Fundamentals of A/B Testing
A/B Testing is a powerful statistical tool used to compare the results between two versions of the same marketing asset such as a webpage or email in a controlled environment. An example of A/B testing is when Electronic Arts created a variation version of the sales page for the popular SimCity 5 simulation game, which performed 40% better than the control page. Speaking about video games, in this free practice test, you are a data analyst who is tasked with the job to conduct A/B testing for a game developer. You are going to be asked to choose the best way to perform an A/B test, identify the null hypothesis, choose the right evaluation metrics, and ultimately increase revenue through in-game ads.
Learn More
Intrо to Machine Learning
State-of-the-art machine learning algorithms have opened a whole new realm of possibilities for businesses to optimize their processes and create new product/service features, that maximize competitive advantages. Used in recommendation systems, fraud detection, spam filtering, self-driving cars, to name a few, these advanced algorithms are only getting more popular by the day. Take this free machine learning practice exam and test your knowledge on supervised, unsupervised and reinforcement machine learning, and their applications.
Learn More
Introduction to Data Science Disciplines
The term “Data Science” dates back to the 1960s, to describe the emerging field of working with large amounts of data that drives organizational growth and decision-making. While the essence has remained the same, the data science disciplines have changed a lot over the past decades thanks to rapid technological advancements. In this free introduction to data science practice exam, you will test your understanding of the modern day data science disciplines and their role within an organization.
Learn More
Simple Linear Regression with sklearn in Python Template
The following Simple Linear Regression with sklearn in Python template shows how to solve a simple linear regression problem using the machine learning package sklearn.. Download and unzip the .zip file in a new folder. Inside the folder you will find a .csv and a .ipynb file. The first one contains the database and the second one contains the Python code. Open the .ipynb file using Jupyter notebook. Some other related topics are Multiple linear regression with sklearn Python, Linear regression with statsmodels Python, Regression summary table with sklearn Python. You can now download the Python template for free. Predictions with statsmodels in Python is among the topics covered in detail in the 365 Data Science program.
Learn More
Multiple Linear Regression with sklearn in Python Template
The following Multiple Linear Regression with sklearn in Python template shows how to solve a multiple linear regression problem using the machine learning package sklearn. Download and unzip the .zip file in a new folder. Inside the folder you will find a .csv and a .ipynb file. The first one contains the database and the second one contains the Python code. Open the .ipynb file using Jupyter notebook. Some other related topics are Simple linear regression with sklearn Python, Linear regression with statsmodels Python, Regression summary table with statsmodels Python. You can now download the Python template for free. Multiple Linear Regression with sklearn in Python is among the topics covered in detail in the 365 Data Science program.
Learn More
Predictions with statsmodels in Python Template
Description:The following Predictions with statsmodels in Python template shows how to solve a multiple linear regression problem and make predictions based on your own data. At the end of thе notebook, you will learn how to create a dataframe summarizing you findings. Download and unzip the .zip file in a new folder. Inside the folder you will find a .csv and a .ipynb file. The first one contains the database and the second one contains the Python code. Open the .ipynb file using Jupyter notebook. Some other related topics are Predictions with standardized Coefficients with sklearn Python, Linear Regression Model in Python - predictions versus targets, Visualizing Linear Regressions with matplotlib Python. You can now download the Python template for free. Predictions with statsmodels in Python is among the topics covered in detail in the 365 Data Science program.
Learn More
Mapping Categorical to Numerical Data with pandas in Python Template
The following Mapping Categorical to Numerical Data with pandas in Python template shows how to deal with categorical variables in a dataset. The dataset contains an 'Attendance' feature whose categories are either 'Yes' or 'No'. The program maps the 'Yes' and 'No' categories to 1s and 0s using the pandas library. Download and unzip the .zip file in a new folder. Inside the folder you will find a .csv and a .ipynb file. The first one contains the database and the second one contains the Python code. Open the .ipynb file using Jupyter notebook. Some other related topics are Dummy Variables with pandas Python, Removing Missing Values with pandas Python, Removing Outliers with pandas Python. You can now download the Python template for free. This template is among the topics covered in detail in the 365 Data Science program.
Learn More
Regression Summary Table with Statsmodels in Python Template
The following Regression Summary Table with Statsmodels Python template shows how to solve a simple linear regression problem and output the results using the statsmodels library. The database used for the example is read using the pandas library. Download and unzip the .zip file in a new folder. Inside the folder you will find a .csv and a .ipynb file. The first one contains the database and the second one contains the Python code. Open the .ipynb file using Jupyter notebook. Make sure you have all necessary libraries installed in your environment. Some other related topics you might want to checkout are Regression summary table with sklearn Python, Linear regression with statsmodels Python, Predictions with statsmodels Python, Visualizing linear regressions with matplotlib Python You can now download the Python template for free. Regression Summary Table with Statsmodels in Python is among the topics covered in detail in the 365 Data Science program.
Learn More
Side by Side Bar Chart in Excel Template
This Side by Side Bar Chart in Excel uses a cross-table for the construction of a side-by-side bar chart. Some other related topics you might be interested to explore are Cross Bar chart in Excel, Bar chart in Excel, Pie chart in Excel, Histogram in Excel, Frequency Distribution Table for Numerical Variables You can now download the Excel template for free. Cross Table in Excel is among the topics covered in detail in the 365 Data Science program.
Learn More
Histogram in Excel Template
This Histogram in Excel includes a sample dataset, a frequency distribution table constructed from this dataset, and 2 histograms visualizing the data - one representing frequency and a second one representing relative frequency. Some other related topics you might be interested to explore are Pie Chart in Excel, Line Chart in Excel , Bar and Line Chart in Excel and Stacked Area Chart in Excel. You can now download the Excel template for free. Histogram in Excel is among the topics covered in detail in the 365 Data Science program.
Learn More
Frequency Distribution Table for Numerical Variables in Excel Template
This Frequency Distribution Table for Numerical Variables in Excel template demonstrates the typical construction of a frequency distribution table. It shows how the data can be divided into intervals, how the count of items in a given interval is performed and how relative frequencies are calculated. Some other related topics you might be interested to explore are Pie Chart in Excel, Line Chart in Excel , Bar and Line Chart in Excel and Stacked Area Chart in Excel. You can now download the Excel template for free. Frequency Distribution Table for Numerical Variables in Excel is among the topics covered in detail in the 365 Data Science program.
Learn More
Cross Table in Excel Template
This Cross Table in Excel shows how a typical cross-table can be constructed. The rows of the table represent the type of investment while the investors are placed as columns. Each cell, therefore, shows how much each person invested and where. Some other related topics you might be interested to explore are Side-by-side bar chart in Excel, Bar chart in Excel, Pie chart in Excel, Histogram in Excel, Frequency Distribution Table for Numerical Variables. You can now download the Excel template for free. Cross Table in Excel is among the topics covered in detail in the 365 Data Science program.
Learn More
Normal Distribution in Excel Template
This Normal Distribution in Excel template demonstrates that the sum of 2 randomly thrown dice is normally distributed. Open the .xlsx file with Microsoft Excel. Study the structure of the file and experiment with different values. Some other related topics you might be interested to explore are Positive Skew in Excel, Zero Skew in Excel, Negative Skew in Excel, Uniform Distribution in Excel, Standard Normal Distribution in Excel You can now download the Excel template for free. Normal Distribution in Excel is among the topics covered in detail in the 365 Data Science program
Learn More
Advanced SQL
In this free Advanced SQL practice exam you are a sophomore Business student who has decided to focus on improving your coding and analytical skills in the areas of relational database management systems. You are given an employee dataset containing information like titles, salaries, birth dates and department names, and are required to come up with the correct answers. This free SQL practice test will evaluate your knowledge on MySQL aggregate functions , DML statements (INSERT, UPDATE) and other advanced SQL queries.
Learn More
Data Manipulation in SQL
SQL is one of the top programming languages that is used by top global companies like Microsoft, Spotify, Netflix, and Uber thanks to its amazing data retrieval, storage, and manipulation abilities. In this free Data Manipulation in SQL practice exam, we will be testing your knowledge on the SQL DML( Data Manipulation Language) statements, the WHERE clause, the CALL Statement, and SQL stored routines and procedures.
Learn More
SQL SELECT Statement
SQL is one of the most popular and in-demand programming languages, because of its intuitive syntax, ubiquitous presence in the business world, and ability to query data and perform analysis. Therefore, possessing SQL skills will give you a significant career advantage in the modern data-driven workforce. Test your knowledge in the basics of SQL with this free SQL SELECT Statement practice exam designed by 365 Data Science instructor Martin Ganchev. These set of SQL questions will test your knowledge on creating databases, SQL Constraints, and the SQL Select Query by giving you a free .sql file containing company data, to work with.
Learn More
Scatter Plot in Excel Template
This Scatter Plot in Excel Template displays the relationship between the area and price of a California real estate data set, allowing us to see if any connection exists between the two variables. Some other related topics you might be interested to explore are Pie Chart in Excel, Line Chart in Excel , Bar and Line Chart in Excel and Stacked Area Chart in Excel. You can now download the Excel template for free. Scatter Plot in Excel is among the topics covered in detail in the 365 Data Science program.
Learn More
Pareto Diagram in Excel Template
This Pareto Diagram in Excel shows how visualize categorical data, by representing the number of cars per brand a car shop has sold. Some other related topics you might be interested to explore are Pie Chart in Excel, Line Chart in Excel , Bar and Line Chart in Excel and Stacked Area Chart in Excel. You can now download the Excel template for free. Pareto Diagram in Excel is among the topics covered in detail in the 365 Data Science program.
Learn More
Bar and Line Chart in Excel
This Bar and Line Chart in Excel Template uses a dual y-axis and shows the number of participants of a survey using a bar chart and the percentage among them using the Python programming language using a line chart. Some other related topics you might be interested in exploring are Scatter Plot in Excel, Pie Chart in Excel, Line Chart in Excel, and Stacked Area Chart in Excel. You can now download the Excel template for free. Bar and Line Chart in Excel is among the topics covered in detail in the 365 Data Science program.
Learn More
While Loops in R Template
The While Loops in R shows how to create a while loop which sums up the numbers from 1 to n. A while loop operates as long as, or while its condition evaluates to TRUE. In contrast to a for loop which iterates over a sequence of number, the while loop evaluates whether a condition holds or not. Some other related topics you might be interested in exploring are For Loops in R and If Else Else If Statements in R. You can now download the R template for free. Calculating Data Variance in R is among the topics covered in detail in the 365 Data Science program.
Learn More
Calculating Data Variance in R Template
The Calculating Data variance in R shows how variance measures the dispersion of a set of data points around their mean value. Some other related topics you might be interested are Calculating Standard Deviation in R, Calculating Data Mean in R, Calculating Standard Deviation of Data in R, Exploring Data Skewness in R You can now download the R template for free. Calculating Data Variance in R is among the topics covered in detail in the 365 Data Science program.
Learn More
If Else Else If Statements in R Template
The If Else Else IF Statements in R template shows whether a certain condition is met and can perform distinct actions provided the condition is met, and provided it is not. Some other related topics you might be interested in exploring are While loops in R and For Loops in R You can now download the R template for free. If Else Else If Statements in R is among the topics covered in detail in the 365 Data Science program.
Learn More
Not Null Constraint in SQL Template
The Not Null Constraint in SQL template shows you how to assign a PRIMARY KEY constraint, specifying that the values of the constrained email must uniquely identify each row. Download and unzip the .zip file in a new folder. Inside the folder you will find a .sql file. Load it into MySQL Workbench. Some other related topics you might be interested are Primary Key Constraint in SQL, Unique Constraint in SQL and Default Constraint in SQL . You can now download the SQL template for free. Not Null Constraint in SQL is among the topics covered in detail in the 365 Data Science program.
Learn More
Primary Key Constraint in SQL Template
The Primary Key Constraint in SQL template shows you how to assign a Primary Key constraint, specifying that the values of the constrained email must uniquely identify each row. Download and unzip the .zip file in a new folder. Inside the folder you will find a .sql file. Load it into MySQL Workbench. Some other related topics you might be interested are Not Null Constraint, Unique Constraint and Default Constraint. You can now download the SQL template for free. Primary Key Constraint in SQL is among the topics covered in detail in the 365 Data Science program.
Learn More
Default Constraint in SQL Template
The Default Constraint in SQL template shows you how to assign a default value to a column in a table. If no other value is specified it will be added to all new records. Download and unzip the .zip file in a new folder. Inside the folder you will find a .sql file. Load it into MySQL Workbench. Some other related topics you might be interested are Primary Key Constraint in SQL, Not Null Constraint, and Unique Constraint. You can now download the SQL template for free. Default Constraint in SQL is among the topics covered in detail in the 365 Data Science program.
Learn More
Unique Constraint in SQL Template
The Unique Constraint in SQL template shows you how to assign a UNIQUE KEY constraint to a table, used to avoid any duplicates and ensure unique values in the column. Download and unzip the .zip file in a new folder. Inside the folder you will find a .sql file. Load it into MySQL Workbench. Some other related topics you might be interested are Primary Key Constraint in SQL, Not Null Constraint, and Default Constraint. You can now download the SQL template for free. Unique Constraint in SQL is among the topics covered in detail in the 365 Data Science program.
Learn More
Cross Join in SQL Template
The Cross Join in SQL template shows you how to take the values from a certain table and connects them with all the values from the tables we want to join it with. Download and unzip the .zip file in a new folder. Inside the folder you will find a .sql file. Load it into MySQL Workbench. Some other related topics you might be interested are Inner JOIN in SQL, Left JOIN in SQL, and Right JOIN in SQL. You can now download the SQL template for free. Cross JOIN in SQL is among the topics covered in detail in the 365 Data Science program.
Learn More
Right Join in SQL Template
The Right Join in SQL template shows you how to create a new instance of a table combining rows that have matching values from two tables plus all values from the right table that match no values from the left one. Download and unzip the .zip file in a new folder. Inside the folder you will find a .sql file. Load it into MySQL Workbench. Some other related topics you might be interested are Inner JOIN in SQL, Left JOIN in SQL, and Cross JOIN in SQL. You can now download the SQL template for free. Right JOIN in SQL is among the topics covered in detail in the 365 Data Science program.
Learn More
Left Join in SQL Template
The Left JOIN in SQL template shows you how to create a new instance of a table combining rows that have matching values from two tables plus all values from the left table that match no values from the right one. Download and unzip the .zip file in a new folder. Inside the folder you will find a .sql file. Load it into MySQL Workbench. Some other related topics you might be interested are Inner JOIN in SQL, Right JOIN in SQL, and Cross JOIN in SQL. You can now download the SQL template for free. Left JOIN in SQL is among the topics covered in detail in the 365 Data Science program.
Learn More
Scatter Plot with ggplot2 in R Template
The Scatter Plot with ggplot2 in R includes a color scheme from the Wes Anderson movie palette. The chart displays the relationship between the price and area of houses from a property data set. A scatter plot is one of the most widely used charts in statistics and data analytics. It shows a collection of data points across two axes, signifying two categories of the data we wish to compare. Some other related topics you might be interested are Bar chart with ggplot2 in R, Histogram with ggplot2 in R, Regression Scatter Plot with ggplot2 in R, and Line Chart with ggplot2 in R. You can now download the R template for free.
Learn More
Exploring Data Skewness in R Template
The Exploring Data Skewness in R template shows whether the observations in a data set are concentrated on one side. Here you can see examples of three different data skews implemented in R - right skewness, zero skewness and left skewness. Some other related topics you might be interested in exploring are Calculating Data Variance in R, Calculating Data Median in R, Calculating Standard Deviation of data in R. You can now download the R template for free. Calculating Data Median in R is among the topics covered in detail in the 365 Data Science program.
Learn More
Calculating Data Median in R Template
The following Calculating Data Median in R template shows the mean, also known as the simple average. We can find the mean of a data set by adding up all of its components and then dividing them by the number of components contained in the data set. Some other related topics you might be interested in exploring are Calculating Data Variance in R, Calculating Data Median in R, Calculating Standard Deviation of Data in R and Exploring Data Skewness in R. You can now download the R template for free. Calculating Data Median in R is among the topics covered in detail in the 365 Data Science program.
Learn More
Stacked Area Chart with ggplot2 in R Template
The following Stacked Area Chart with ggplot2 in R template shows the popularity of different engine types in automobiles across several decades. An area chart is used when we are interested in tracking and comparing the volume of a few variables over time. In a stacked area chart each category is ‘stacked’ or ‘placed’ on top of the previous and there is no overlap among categories. Some other related topics you might be interested in exploring are Line Chart with ggplot2 in R, Bar Chart with ggplot2 in R, Pie Chart with ggplot2 in R and Scatter Plot with ggpot2 in R. You can now download the R template for free. Stacked Area Chart with ggplot2 in R is among the topics covered in detail in the 365 Data Science program.
Learn More
For Loops in R Template
The following For Loops in R shows how to calculate the sum of the numbers from 1 to 10 using a for loop. For loops are one of the most commonly used tools by any programmer and they are used when we want to repeat an action in the loop for a certain number of times. Some other related topics you might be interested in exploring are While Loops in R and If Else Else If statements .
Learn More
Creating a Data Frame Object in R Template
The following Creating a Data Frame Object in R template shows you how to create a data frame in R from scratch and populate with different values. The example shows a car data frame, containing 5 columns, 3 of which are numeric and 2 of which are strings. You can use this template to create and fill out your own data frame. Some other related topics you might be interested to explore are Calculating Data Variance in R, Calculating Data Mean in R, Calculating Standard Deviation of Data in R, Exploring Data Skewness in R. You can now download the R template for free. Creating a Data Frame Object in R is among the topics covered in detail in the 365 Data Science program.
Learn More
Machine Learning with Decision Trees and Random Forests
Decision trees are a popular intuitive supervised machine learning algorithm, that is part of the sklearn library, and has wide areas of applications like- business growth opportunities evaluation, demographic-driven data client targeting, and strategic management planning. Every machine learner worth their salt needs to familiarize themselves with the decision trees machine learning model. These free machine learning with random forests and decision trees pdf course notes will teach you how do decision trees work, how they ensemble into the random forest algorithm, what are their pros and cons, which are the most commonly used performance metrics and much more.
Learn More
How to Become a Business Analyst
The business analyst is one of the most dynamic roles in a company, as they are tasked with the responsibility to bridge the organization’s information technology capabilities with its business goals. Combined with a high-paying salary and room for career growth , the position is a highly desired career by many business professionals. Therefore, we have created this free pdf infographic that is going to cover what does a business analyst do, salary information, business analyst skills requirements and career path to show you what to expect and decide for yourself if this is the right career for you.
Learn More
Stacked Area Chart in Excel Template
This Stacked Area Chart in Excel template displays the use of different fuel types from the year 1975 to 2016 for used cars. The chart is created with the stacked area chart in Excel. For completion a 100% stacked version of the chart is shown. Some other related topics you might be interested to explore are Pie Chart in Excel, Line Chart in Excel, and Scatter Plot in Excel. You can now download the Excel template for free. Stacked Area Chart is among the topics covered in detail in the 365 Data Science program.
Learn More
Data Strategy
Companies that sit on treasure troves of data but have no defined or bad data strategy not only fail to collect dividends from their wealth of data, but also incur great financial and reputational losses. In these free pdf course notes on Data Strategy, you will learn what is the purpose of a company’s data strategy, how data strategy helps build competitive advantage, how to create technology and data infrastructures that support business growth and much more.
Learn More
Dealing with Missing Data in R Template
This Dealing with Missing Data in R template shows you how to check for missing values in a dataset and count them. It also provides two ways of dealing with missing values in a dataset - either by substituting the missing values with the average, or by removing the entries which have missing values in them. Some other related topics you might be interested to explore are correlation between two variables in R, export data as csv in R, calculating data median in R, calculating data mean in R, and calculating standard deviation of data in R. You can now download the R template for free. Dealing with missing data in R is among the topics covered in detail in the 365 Data Science e-learning program.
Learn More
Intro to Data and Data Science
Rapid technological advancements and the invention of the world wide web have revolutionized the way we view and interact with data, turning data science into an integral part of the business landscape- 50% of the top companies implement data-driven practices. Therefore, if you want to make your first professional steps and find your bearings in the complex world of data science, we recommend you to download these free pdf course notes to Intro to Data and Data Science.
Learn More
For Loops in Python
In this free For Loops in Python practice exam by Python expert and instructor Giles McMullen-Klein, you have just started working as a junior software engineer at Challenger. Your job is to improve the automatization of the supply and distribution processes by using the Python programming language. These Python practice problems are going to test your coding abilities as you are asked to help the company with implementing for-loops, executing conditional statements, and estimating daily sales of certain products.
Learn More
Data Visualization in Middle-Earth
If you have ever wanted to use your data visualization skills for a nobler cause that does not involve revenue growth, then this free Data Visualization in Middle-Earth practice exam, by instructor Elitsa Kaloyanova, is for you. As the faith of Middle Earth is entrusted into your hands, you are required to use your data visualization and interpretation skills in Excel to answer these data visualization quiz questions and save the magic lands from destruction.
Learn More
Line Chart in Excel Template
A line chart is often used when we want to chronologically track the changes in value of a variable over a period of time and identify existing patterns and trends. Therefore, the line chart is often applied in financial statements, weather forecasts, stock market analysis and experiment statistics reports. This free .xlsx template displays the S&P 500 and Footsie indices for the second half of the economically devastating 2008 on a line chart
Learn More
Linear Regression with statsmodels in Python Template
The following Linear Regression with Statsmodels in Python free .ipynb template shows how to solve a simple linear regression problem using the Ordinary Least Squares statsmodels library. We are going to examine the causal relationship between the independent variable in the dataset - SAT score of a student, and the dependent variable -the GPA score. This database is read with the help of the pandas library. Download and unzip the .zip file in a new folder. Inside the folder you will find a .csv and a .ipynb file. The first one contains the database and the second one contains the Python code. Open the .ipynb file using Jupyter notebook.
Learn More
Calculating Standard Deviation of Data in R Template
This free .r template will show you how to calculate the standard deviation of data using the R programming language. The standard deviation is obtained by taking the square root of the variance of the data. It is used in many statistical analyses, whenever we have numerical data and is a measure of data dispersion. The standard deviation shows how closely data sits around the mean – a small value shows data, which is densely populated around the mean, a large standard deviation signifies data which is more dispersed.
Learn More
Inner Join in SQL Template
Joins are the SQL tools that allow us to work with data from multiple tables simultaneously relying on the logical relationship between their objects. The INNER JOIN clause, in particular, creates a new instance of a table that combines rows with matching values from two tables. Thus, null values, or values appearing only in one of the tables, will not be extracted. In this free sql template you will be applying the SQL Inner Join clause on a set of business department tables.
Learn More
Creating a database in SQL Template
Developed in the 1970s by a group of IBM researchers, SQL continues to be the most popular programming language for relational database management and is used by companies like Facebook to store mounts of user data. None of this would be possible without the foundation of the SQL language- the database. That is the place where information is organized into tables and can be accessed, manipulated, and retrieved in any desired way. Consider this as the very first step in your SQL journey as this free sql template will show you how to make a SQL database in MYSQL.
Learn More
How to Become a Data Analyst Intern
In the highly competitive data science job market, data analyst internships are a perfect way for you to gain hands-on experience working with data to answer critical business questions, learn important soft skills and expand your networking circle for career growth. The 365 Data Science Data Analyst Intern infographic will show you how to get a data analyst internship by going over the position responsibilities, the required technical skills and educational background for the data analyst position.
Learn More
Interpreting Data
The free Interpreting Data practice exam by top business executive and data enthusiast Oliver Maugain who has had a prolific career in the financial, advertising, and chemical industry. His goal is to help students master the language of data by personally creating this set of data literacy exercises that are meant to put your data interpretation skills to the test, as you are asked to perform various fundamental analyses techniques on a set of real estate sales data.
Learn More
Reading Data
These free Reading Data test questions were carefully crafted by top data culturist Oliver Maugain- Decision Intelligence Manager at a major European retailer who supports the organization in making better and faster decisions using data. The Reading Data practice exam is going to put your data description ability to the test as you are asked to describe the basic characteristics of a travel questionnaire- like the standard deviation, median and mode of the dataset.
Learn More
Using Data
This free practice exam on Using Data designed by 365 Data Science collaborator Oliver Maugain- top-level executive at a major European retail brand and a passionate data literacy teacher who wants to popularize the language of data. The data literacy assessment exam contains data literacy questions which are going to test your comprehension on how data is being used and the different machine learning and business analytics techniques.
Learn More
Understanding Data
This set of data literacy test questions were carefully crafted by top data culturist Oliver Maugain- Decision Intelligence Manager at a major European retailer who supports the organization in making better and faster decisions using data. The Data Literacy Intro practice exam contains 6 data literacy questions which are going to quiz you on data terminology, different types of data, different data storage systems and the technical tools required to analyze data.
Learn More
Having Clause in SQL Template
SQL is specifically designed to help you navigate through large amounts of structured data, modifying, retrieving, and creating new tables out of it. The having clause works in conjunction with common aggregate functions like min, max, ave, count and sum, and allows you to filter and return group results that meet the specified conditions. In this free sql template, you will apply the having clause to display salaries that are higher than a certain value in ascending order.
Learn More
Machine Learning with K-Nearest Neighbors
K Nearest Neighbors - also known as KNN, is one of the most popular AI algorithms thanks to its simplicity of use and relatively high level of accuracy compared to more sophisticated algorithms. The KNN machine learning model has a very fast training process, making it a good machine learning algorithm to analyze multiclass datasets right off the bat. In these free Machine Learning with KNN pdf course notes, you will learn about the algorithm’s pros and cons, defining distance metrics, the important steps in creating a KNN model and the most commonly used performance metrics.
Learn More
Data Literacy Intro
Data has become a universal language for modern businesses and organizations who strive to use it strategically to gain better insights about the market. If you aspire to become proficient in the language of data and be at the forefront of business growth, the first step is to familiarize yourself with the concepts in the free pdf course notes on introduction to data literacy. Learn what defines a data literate individual, the purpose of data literacy in the modern data ecosystem, what data-driven decision making looks like and what are the benefits of working with data.
Learn More
World of Supervised Machine Learning
Тhe introduction of Artificial Intelligence and its subset Machine Learning have introduced a whole new paradigm of possibilities in the realm of data related activities. In this visually beautiful World of Supervised Machine Learning infographic, we are giving essential information on all the different types of supervised machine learning, starting from the least complex - Linear Regression, to the most complex- XGBoost. Some of the things you will learn in this free pdf infographic are the advantages and disadvantages of each type, their algorithm speed, preprocessing, starter datasets and areas of application.
Learn More
The 365 Data Science All In One Infographic
Data science is a relatively new field that combines various disciplines like mathematics, statistics, machine learning, data analytics and programming, which is why coming to a universal definition and understanding of this ever growing field is quite the challenge. Despite that, the 365 Data Science Team has united their efforts to create a comprehensive overview of the data science field. This free 365 Data Science pdf infographic covers the types of data, the associated data techniques, the data related professions, places of application and more, giving you a holistic picture of data science.
Learn More
Data Literacy
Data literacy is the ability to work with, comprehend and communicate data that generates logarithmic amount of value across all business departments. In the global workplace, where data usage and automation are rapidly positioning themselves at the heart of business operations, the need for a data literate workforce has never been higher. Studying these free pdf course notes on data literacy by top-data executive Oliver Maugain will help you leverage your newly learned data skills in this highly rewarding job market, which is experiencing a systemic data talent shortage.
Learn More
Interpreting Data
By now you should have a solid understanding of data terminology, data quality assessment, different data storage systems, AI applications and Machine Learning techniques. We are going to conclude the series of free pdf data literacy course notes with data interpretation- a key component in the evaluation of financial assets on the financial market, prediction of market behavior, problem-solving in the fields of medicine and etc.
Learn More
Reading Data
The consequences of businesses who do not perform data quality assessments can be devastating to business growth. Poor data quality can lead to executing the wrong business strategies, reduced efficiency, increased financial costs, damaged customer relationships and ultimately to bankruptcy. Therefore, in the third part of the free pdf course notes on data literacy, we provide information on how to read data, by distinguishing between good and bad data, what are the negative impacts of poor data quality, and the various descriptive methods that characterize a dataset.
Learn More
Using Data
AI is the modern day facilitator of human productivity that allows for human intelligence to execute feats that would have been considered impossible a few decades ago. As modern businesses integrate AI and its Machine Learning capabilities with their decision-making and operational activities, the need for data competent individuals who can help with the integration process has never been higher. Therefore, in the Using Data free pdf course notes we will familiarize you with the practical applications of AI and ML, the types of supervised and unsupervised machine learning techniques and natural language processing abilities of AI.
Learn More
Understanding Data Literacy
Thanks to the mass digitalization of the world, information has become the oil of the 21st century that sustains the engines of modern businesses. As of 2021, there are approximately 4,66 billion internet users! Imagine the amount of data, that consumers leave behind that just waits to be stored and processed by businesses. Therefore, in these free pdf course notes on Understanding Data Literacy, we are going to identify various types of data, the three defining properties of Big Data and the different methods for storing data.
Learn More
Strings & Conditionals in Python
The free Strings & Conditionals practice exam is made by famous YouTube Python Programmer and teacher Giles McMullen-Klein. In this practice case, you are a first year Software Engineer who is taking his end-of-year exam, where you are required to use the relevant Python techniques to pass. This set of Python programming practice questions is going to test your foundations in printing functions, conditional expression execution and indexing in string slicing.
Learn More
Box and Whiskers Chart with ggplot2 in R
A box and whiskers chart graphically represents the distribution of data through their quartiles. It is often used in financial settings when analyzing the market volatility and can reveal the skewness of data or potential outliers. Тhis free .r template goes over the Titanic’s data set using the ggplot2 library in R, revealing interesting insights about e the survival rate based on age and sex. By following the outlined steps in this R template, you will learn how to convey the information professionally using the ggplot2 functionalities.
Learn More
Intro to Stacks and Matplotlib Visualization
In this free Intro to Stacks and Matplotlib Visualization practice exam by Oxford physics graduate and experienced Python programmer Giles McMullen-Klein, you are the software engineer for a scientific research agency. Your task is to conduct research on the relationship between innovative eye-tracking technology and voting behavior in the USA, therefore these Python practice exercises are going to test your coding skills and ability to visually represent your conclusions in matplotlib.
Learn More
Files and Functions in Python
Prominent figure in the online Python community and established programming teacher Giles McMullen-Klein created this free practice exam on Files and Functions in Python where you are working as an app developer for sports startup company. The success of the project depends on your Python skills; therefore, these Python practice test questions are going to quiz you on Python code writing efficiency, file handling, dictionary functions and object creation.
Learn More
Implementing a Stack in Python
Inevitably, all of us have experienced the stack structure in our daily lives- whether it is shuffling a deck of cards, using the undo button in Word, or browsing back and forth between webpages. In the following free .ipynb notebook, you will find an implementation of a Stack class from scratch – showing you how to check the stack’s status, append(push) as well as remove(pop) items from the stack
Learn More
Line and Scatterplots with Matplotlib in Python
The following notebook will guide you through the process of creating a line plot and a scatter plot using the matplotlib library in Python. The data that you are going to be working with in this free .ipynb template is the number of daily views on a video for a period of 30 days. You will learn how to customize the style of your plot by changing the figure sizes, and the line’s style and colors. You will also learn how to put markers on the plot, give name to the axes and put a title on the figure.
Learn More
Data Science Interview Process
According to Senior Data Scientist Ken Jee Less than 5% of data scientist job applicants successfully land a job. Most of the time, the main reason for this low success rate is the applicant’s misrepresentation of their skills and not their lack of qualifications, which is why in this free Data Science Interview Process practice exam you are going to be tested on the methodology behind successfully passing the recruitment process- the phone interview, the take home test and the in-person interview.
Learn More
Data Science Project Portfolio
Senior data scientist and data influencer Ken Jee created this free Data Science Project Portfolio practice exam that goes over the case of Caroline - statistics graduate who has started her job searching journey in the fields of data science. This set of data science career questions are going to test your knowledge on how to differentiate yourself from the sea of other applicants.
Learn More
AI & Data Product Deployment
Danielle The’- expert AI Product Manager at Instagram and ambitious Machine Learning advocate, has created this free Product Management for AI & Data Science practice exam that is going to test your nuanced understanding of the different AI product deployment methods and the monitoring techniques involved in the post -deployment process - like selecting feedback metrics and implementing feedback loops.
Learn More
Frameworks for AI & Data Products
In this free Frameworks for AI & Data Products practice exam you are a product manager who enrolled in a workshop with the intent of learning how to adopt a more strategic perspective on AI product management. These set of problems challenge your expertise in AI Product Management by asking you to choose the appropriate ideation technique, evaluate the performance of a model and software development framework, and decide when the model is ready for deployment.
Learn More
Business Strategy and UI for AI & Data Science
This free Product Management for AI & Data Science practice exam is made by Instagram Senior Product Manager and tech enthusiast Danielle The’, whose hopes are to simplify the digital world to businesses and individuals alike. These Product Management for AI & Data Science Problems are going to test your knowledge on key technical concepts, hypothesis formation and testing, and the AI methodologies in creating memorable user experience.
Learn More
Business Analytics Lifecycle
This free practice exam on Business Analytics Lifecycle by business analytics veteran Randy Rosseel will test your understanding of a successful step-by-step implementation of the six stages of the analytics lifecycle. The Business Analytics Test comes with an Excel file of PMG’s financials- major European consumer goods company- where you are asked to put various analytics techniques in to practice.
Learn More
Maturity Stages in Business Analytics Practice
The free Maturity Stages in Business Analytics practice exam was carefully designed by seasoned business intelligence analyst Randy Rosseel -Finance Director at Coca Cola Enterprises and avid proponent of business analytics education. These business analytics exercises will require you to identify the key value drivers, choose the right metrics, and view holistically the stages of analytics for a major Australian coffee producer.
Learn More
End-to-End Business Analytics
The End-to-End Business Analytics Practice Exam was hand-made by experienced financial executive at Coca-Cola- Randy Rosseel. He enjoys sharing his expertise with students, teaching them the analytical capabilities required to drive business growth. Therefore, he created this set of Business Analytics Exercises that are meant to test how nuanced your understanding of end-to-end processes is and how they fit in the overall structure of a business.
Learn More
Data Visualization with Tableau
Head of 365 Data Science Course Creation- Elitsa Kaloyanova, brings you this free practice exam in Data Visualization with Tableau where you are asked to be the survey conductor for a top market researcher company. Based on the survey results, you are required to use Tableau to answer the data visualization practice questions related to the overall trends observed throughout the year and the factors behind them.
Learn More
Data Visualization with ggplot2
Former computational biologist turned data scientist Elitsa Kaloyanova, created this data visualization practice test where you are accepted as the new data analyst intern in the largest bank in the UK. As your responsibility to guide the finance team in the process of data interpretation, your knowledge on the R programming language and the ggplot2 library are going to be tested in these data visualization with ggplot2 test questions.
Learn More
Intro to Data Visualization
This free Intro to Data Visualization practice exam is designed by the head of 365 Data Science content creation- Elitsa Kaloyanova. These data visualization practice questions revolve around the data base of a well-known supermarket chain, where you as the data analyst, are tasked with the job to boost sales and meet customer needs better. Your ability to choose the right visualization tool, discover meaningful insights and guide business strategy accordingly will be put to the test.
Learn More
Data Manipulation with NumPy
In the case of this Data Manipulation with NumPy practice test created by Data Analytics Instructor Victor Mehandziyski you have decided to revise your knowledge on data preprocessing with NumPy by taking last year’s exam. You are required to answer the questions on this free practice exam that are going to put your data manipulation skills to the test- like substituting missing values in NumPy Ndarrays, sorting them and reordering data in a specific way.
Learn More
Statistics with NumPy
In this free Statistics with NumPy practice exam assessment created by Professional Financial Analyst and 365 Data Science Instructor Victor Mehandziyski you are a data analytics student who wishes to put his knowledge into practice. These set of NumPy exam questions are going to quiz your knowledge on statistical functions in NumPy- like finding the minimal or maximum values, identifying the median, and the correlation or covariance between rows.
Learn More
Incorporating URL parameters into a GET request in Python Template
A GET request is used when we want to obtain a certain document from a server- like a web page or API output. However, we can also add different parameters to the request to obtain a more specific result – either by modifying or adding additional information. In this free .ipynb template, we will show you how to incorporate such parameters into the URL by using the "requests" Python package.
Learn More
Handling JSON with “json” library in Python Template
This is a free .ipynb template demonstrating how to handle JSON files using Python and the 'json' library. JSON is a standard data exchange format, frequently encountered on the web, mainly as the output of APIs. It uses 2 main datatypes common to many programming languages - lists and dictionaries, which are going to be covered in the template.
Learn More
Scatter Plot with Seaborn in Python Template
The seaborn library has been one of the most popular Python libraires in recent years. Compared to matplotlib, seaborn has simpler and more intuitive syntax, and wider visual-enhancing features. This free .ipynb Scatter Plot with Seaborn in Python template shows the relationship between the price and area of houses, based on real estate data. It's easy and intuitive to build and customize a scatter plot with the help of seaborn.
Learn More
Pie Chart in Excel Template
Pie charts are one of the most popular data visualization tools since they express the part-to whole relationship of a dataset in a very intuitive manner. As such they are best used when we want to communicate for example the revenue of each product and its relationship to the whole. The following free. xlsx template shows an Excel pie chart, displaying the number of cars using a particular type of fuel.
Learn More
Histogram with ggplot2 in R Template
The histogram is a popular graph for visually representing the data distribution of a feature. This is a free .r histogram template showing the distribution of house prices implemented in R using ggplot2. You will be taught how to build the first three layers of a ggplot- defining the data, aesthetics, and geometry, and set bin parameters You finish by adding a title, changing the background theme and visually tweaking the aesthetics of your histogram.
Learn More
Sending a GET Request in Python Template
This free .ipynb template demonstrates how to send an HTTP GET request in Python which is the backbone of the modern internet- the most popular one is the GET request. This type of request is the most basic form of request since it is sent to servers when opening web pages or accessing APIs. In this template, we have implemented a simple GET request using the Python library "requests".
Learn More
Machine Learning with Naïve Bayes
Naïve Bayes Classifier is a supervised classification machine learning algorithm inspired by the Bayes Theorem. Its ability to make intuitive real time-predictions from small non-linear sets makes it perfect for consumer behavior predictions, recommendation systems and text analysis - news article categorization, email category filtering and sentiment analyses. In the free Machine Learning with Naïve Bayes pdf course notes we are going to build upon your sklearn Naïve Bayes skills by going over the algorithm’s computational capabilities, outlining the 7 steps in creating a supervised machine learning model and identifying 6 relevant metrics to use for performance evaluation.
Learn More
Stacked Area Chart Notebook in Matplotlib Python Template
In this free .ipynb template we have a stacked area chart, implemented in Python with the Pyplot module of Matplotlib. The chart shows the popularity of different engine types in automobiles across the span of several decades. In the stacked area chart each category is ‘stacked’ or ‘placed’ on top of the previous, presenting the totality of the data and avoiding overlap among categories.
Learn More
Generalizing Data with NumPy
365 Data Science Content Creator Viktor Mehandziyski created this Generalizing Data with NumPy practice test where funnily enough, you are an aspiring data analyst who is required to pass a Python exam to proceed with the course. These free NumPy practice exam is going to test your ability to generate arrays of random and non-random data and creating arrays to solve classic statistical problems.
Learn More
NumPy Fundamentals
365 Data Science Instructor Viktor Mehandziyski created this free practice exam on NumPy Fundamentals where you are going to help two computer science students with their upcoming coursework by taking some sample exams. As you help them with revision, the NumPy questions are going to test your understanding of how to perform basic functions with arrays- like slicing, assigning values and determining dimensions.
Learn More